GIS mapping combines seismicity, ground conditions, building exposure, and evacuation routes into multi-layer, spatial models. This gives a clear, specific image of where the greatest dangers are — a critical function in disaster response software designed for earthquake preparedness.
Using this information, planners and emergency responders can target resources, enhance infrastructure strength, and create effective evacuation plans individualized for the zones that require it most.
In this article, we dissect how GIS maps pinpoint high-risk earthquake areas and why this spatial accuracy is critical to constructing wiser, life-saving readiness plans.
Why GIS Mapping Matters for Earthquake Preparedness?
When it comes to earthquake resilience, geography isn’t just a consideration — it’s the whole basis of risk. The key to minimal disruption versus disaster is where the infrastructure is located, how the land responds when stressed, and what populations are in the path.
That’s where GIS mapping steps in — not as a passive data tool, but as a central decision engine for risk identification and GIS and disaster management planning.
Here’s why GIS is indispensable:
- Earthquake risk is spatially uneven. Some zones rest directly above active fault lines, others lie on liquefiable soil, and many are in structurally vulnerable urban cores. GIS doesn’t generalize — it pinpoints. It visualizes how these spatial variables overlap and create compounded risks.
- Preparedness needs layered visibility. Risk isn’t just about tectonics. It’s about how seismic energy interacts with local geology, critical infrastructure, and human activity. GIS allows planners to stack these variables — seismic zones, building footprints, population density, utility lines — to get a granular, real-time understanding of risk concentration.
- Speed of action depends on the clarity of data. During a crisis, knowing which areas will be hit hardest, which routes are most likely to collapse, and which neighborhoods lack structural resilience is non-negotiable. GIS systems provide this insight before the event, enabling governments and agencies to act, not react.
GIS isn’t just about making maps look smarter. It’s about building location-aware strategies that can protect lives, infrastructure, and recovery timelines.
Without GIS, preparedness is built on assumptions. With it, it’s built on precision.
How GIS Identifies High-Risk Earthquake Zones
Not all areas within an earthquake-prone region carry the same level of risk. Some neighborhoods are built on solid bedrock. Others sit on unstable alluvium or reclaimed land that could amplify ground shaking or liquefy under stress. What differentiates a moderate event from a mass-casualty disaster often lies in these invisible geographic details.
Here’s how it works in operational terms:
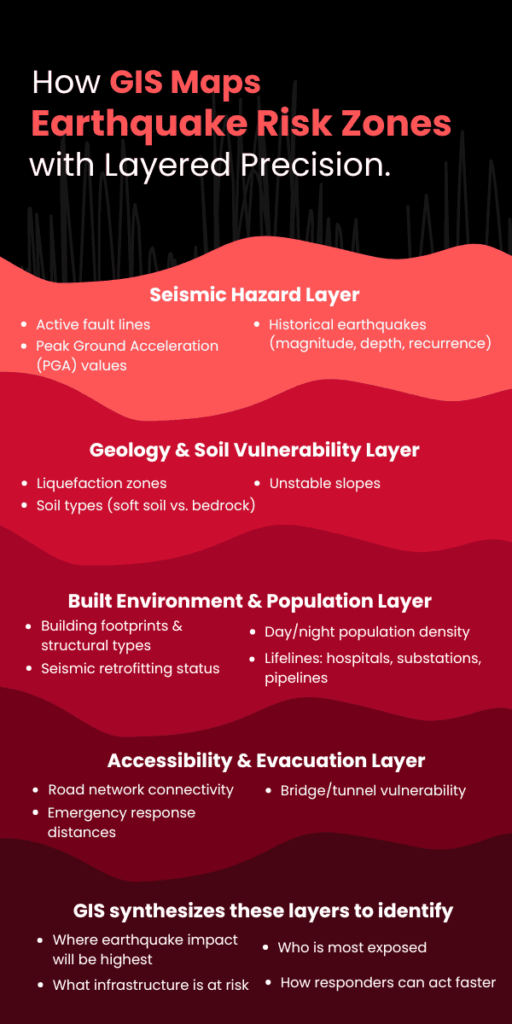
1. Layering Historical Seismic and Fault Line Data
GIS platforms integrate high-resolution datasets from geological agencies (like USGS or national seismic networks) to visualize:
- The proximity of assets to fault lines
- Historical earthquake occurrences — including magnitude, frequency, and depth
- Seismic zoning maps based on recorded ground motion patterns
This helps planners understand not just where quakes happen, but where energy release is concentrated and where recurrence is likely.
2. Analyzing Geology and Soil Vulnerability
Soil type plays a defining role in earthquake impact. GIS systems pull in geoengineering layers that include:
- Soil liquefaction susceptibility
- Slope instability and landslide zones
- Water table depth and moisture retention capacity
By combining this with surface elevation models, GIS reveals which areas are prone to ground failure, wave amplification, or surface rupture — even if those zones are outside the epicenter region.
3. Overlaying Built Environment and Population Exposure
High-risk zones aren’t just geological — they’re human. GIS integrates urban planning data such as:
- Building density and structural typology (e.g., unreinforced masonry, high-rise concrete)
- Age of construction and seismic retrofitting status
- Population density during day/night cycles
- Proximity to lifelines like hospitals, power substations, and water pipelines
These layers turn raw hazard maps into impact forecasts, pinpointing which blocks, neighborhoods, or industrial zones are most vulnerable — and why.
4. Modeling Accessibility and Emergency Constraints
Preparedness isn’t just about who’s at risk — it’s also about how fast they can be reached. GIS models simulate:
- Evacuation route viability based on terrain and road networks
- Distance from emergency response centers
- Infrastructure interdependencies — e.g., if one bridge collapses, what neighborhoods become unreachable?
GIS doesn’t just highlight where an earthquake might hit — it shows where it will hurt the most, why it will happen there, and what stands to be lost. That’s the difference between reacting with limited insight and planning with high precision.
Key GIS Data Inputs That Influence Risk Mapping
Accurate identification of earthquake risk zones depends on the quality, variety, and granularity of the data fed into a GIS platform. Different datasets capture unique risk factors, and when combined, they paint a comprehensive picture of hazard and vulnerability.
Let’s break down the essential GIS inputs that drive earthquake risk mapping:
1. Seismic Hazard Data
This includes:
- Fault line maps with exact coordinates and fault rupture lengths
- Historical earthquake catalogs detailing magnitude (M), depth (km), and frequency
- Peak Ground Acceleration (PGA) values: A critical metric used to estimate expected shaking intensity, usually expressed as a fraction of gravitational acceleration (g). For example, a PGA of 0.4g indicates ground shaking with 40% of Earth’s gravity force — enough to cause severe structural damage.
GIS integrates these datasets to create probabilistic seismic hazard maps. These maps often express risk in terms of expected ground shaking exceedance within a given return period (e.g., 10% probability of exceedance in 50 years).
2. Soil and Geotechnical Data
Soil composition and properties modulate seismic wave behavior:
- Soil type classification (e.g., rock, stiff soil, soft soil) impacts the amplification of seismic waves. Soft soils can increase shaking intensity by up to 2-3 times compared to bedrock.
- Liquefaction susceptibility indexes quantify the likelihood that saturated soils will temporarily lose strength, turning solid ground into a fluid-like state. This risk is highest in loose sandy soils with shallow water tables.
- Slope and landslide risk models identify areas where shaking may trigger secondary hazards such as landslides, compounding damage.
GIS uses Digital Elevation Models (DEM) and borehole data to spatially represent these factors. Combining these with seismic data highlights zones where ground failure risks can triple expected damage.
3. Built Environment and Infrastructure Datasets
Structural vulnerability is central to risk:
- Building footprint databases detail the location, size, and construction material of each structure. For example, unreinforced masonry buildings have failure rates up to 70% at moderate shaking intensities (PGA 0.3-0.5g).
- Critical infrastructure mapping covers hospitals, fire stations, water treatment plants, power substations, and transportation hubs. Disruption in these can multiply casualties and prolong recovery.
- Population density layers often leverage census data and real-time mobile location data to model daytime and nighttime occupancy variations. Urban centers may see population densities exceeding 10,000 people per square kilometer, vastly increasing exposure.
These datasets feed into risk exposure models, allowing GIS to calculate probable damage, casualties, and infrastructure downtime.
4. Emergency Access and Evacuation Routes
GIS models simulate accessibility and evacuation scenarios by analyzing:
- Road network connectivity and capacity
- Bridges and tunnels’ structural health and vulnerability
- Alternative routing options in case of blocked pathways
By integrating these diverse datasets, GIS creates a multi-dimensional risk profile that doesn’t just map hazard zones, but quantifies expected impact with numerical precision. This drives data-backed preparedness rather than guesswork.
Conclusion
By integrating seismic hazard patterns, soil conditions, urban vulnerability, and emergency logistics, GIS equips utility firms, government agencies, and planners with the tools to anticipate failures before they happen and act decisively to protect communities, exactly the purpose of advanced methods to predict natural disasters and robust disaster response software.
For organizations committed to leveraging cutting-edge technology to enhance disaster resilience, SCSTech offers tailored GIS solutions that integrate complex data layers into clear, operational risk maps. Our expertise ensures your earthquake preparedness plans are powered by precision, making smart, data-driven decisions the foundation of your risk management strategy.