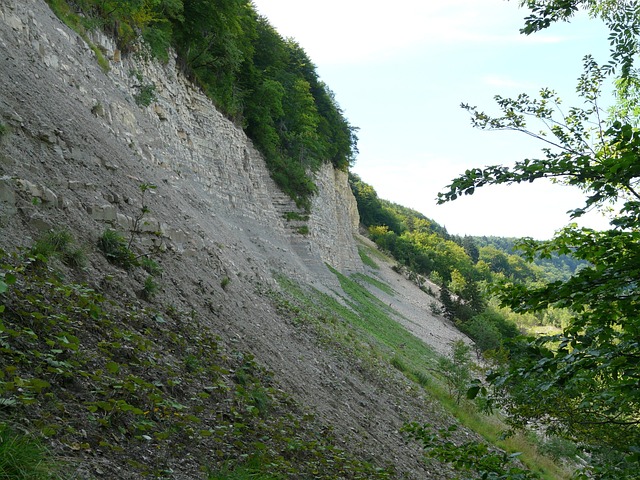
Hilly terrains can turn into danger zones every monsoon season. Roads may vanish, villages get cut off, and entire communities are buried by the slow failure of rain-soaked slopes. The tragedy is not a lack of data. It is a lack of actionable intelligence delivered before the ground moves.
Traditional disaster management solutions have always played catch-up. Rescue teams arrive after the event. Relief funds get sanctioned after the damage is done. But a new generation of technology is changing that timeline. A perfect amalgamation of Internet of Things (IoT) sensors and Geographic Information Systems (GIS) can make reliable, AI-powered early warning systems. They can now predict landslides and floods with enough lead time to evacuate families and shut down vulnerable infrastructure.
This post examines how such AI-powered early warning systems were built, what challenges they solved, and the measurable impact they delivered in the most complex geological terrains.
The Three Invisible Gaps in Disaster Prediction
Predicting a landslide is fundamentally different from predicting rain. Rain is atmospheric, but a landslide is geophysical. It depends on soil porosity, slope angle, root cohesion, and water table depth. These variables can change every fifty meters along a mountain road.
Agencies faced three persistent gaps before the current AI-powered early warning system was deployed:
Zero operational visibility.
There was no centralized platform that could ingest real-time rainfall, satellite imagery, and historical landslide data into a single forecasting engine. Decisions were made using static hazard zone maps that were updated once every few years. They were not useful for a 24-hour monsoon window.
Fragmented stakeholders.
Multiple agencies collected overlapping data. Meteorological departments tracked rainfall. Geological bodies tracked terrain. Disaster authorities handled the response. However, none of them talked to each other in real time. A landslide warning requires all three datasets to be displayed on the same dashboard simultaneously. That was the biggest drawback.
No scientific thresholds in daily use.
Academic papers existed on rainfall thresholds for slope failure. But those thresholds were never plugged into operational workflows. Field teams lacked a standardized protocol for interpreting alerts, verifying them against live sensor data, and issuing a district-level advisory within minutes.
These were not technical problems. Rather, integration problems require a good architecture.
The Technical Architecture: Mechanism of AI-powered Early Warning Systems
The solution deployed by SCS Tech for this client was not a single tool. It was an end-to-end early warning ecosystem. A 24/7 command center designed for rainfall-induced landslides across major risk zones in India.
The architecture rests on three layers.
Layer 1: IoT and Field Sensors
Prediction begins on the ground. A network of IoT devices continuously measures:
Soil moisture content at multiple depths
Pore water pressure within slope strata
Real-time seismic vibrations
Localized rainfall intensity
These sensors transmit data every few minutes via cellular and satellite backhaul. No human intervention or manual reading. Millisecond-level geophysical data flows directly into the processing engine.
Layer 2: AI and Machine Learning Models (Base of AI-Powered Early Warning Systems)
Raw sensor data has no value until patterns emerge. That is where machine learning enters. The AI models are trained on decades of historical landslide events, combining:
Past rainfall intensity-duration thresholds
Terrain susceptibility maps
Real-time soil saturation curves
These models evolve. What does it mean? If a slope fails at lower rainfall than predicted, the algorithm updates its risk scoring for similar geological formations across the region. Over time, the system learns the unique failure signature of every monitored slope.
Layer 3: Enterprise GIS for Visualization and Dissemination
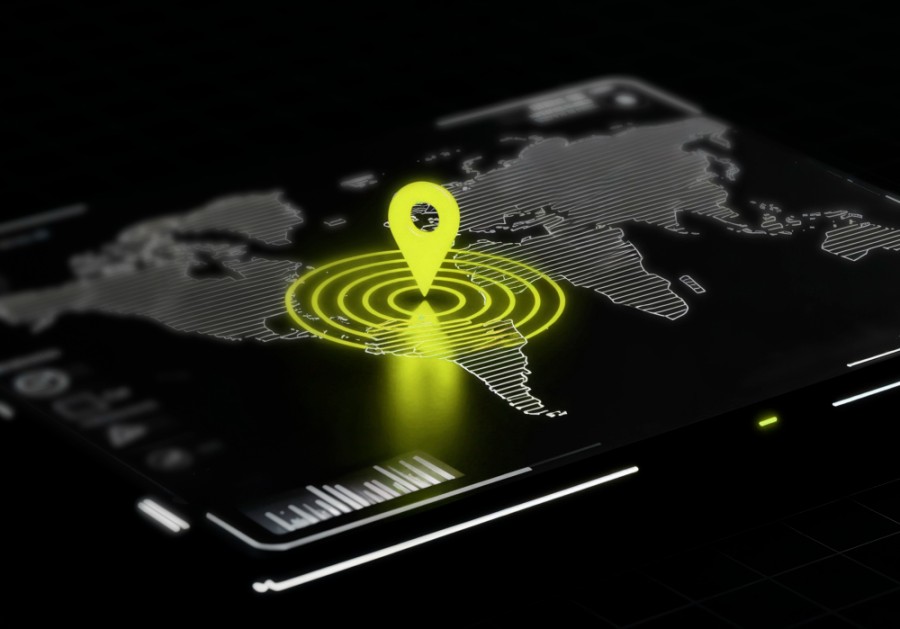
A landslide warning is not useful if it only lives on a scientist’s screen. GIS integration converts model outputs into operational intelligence. The platform layers:
Live weather radar and satellite feeds (NASA, NOAA, MODIS)
Topographical and geological maps
Infrastructure assets (roads, railways, power lines, schools)
Demographic density by village
When the AI flags a high-probability zone, the GIS engine automatically identifies which villages, which road segments, and how many people fall inside that polygon. The alert is not a generic text message. It is a geospatial data analytics.
Solving the Real Business Challenges
The client approached SCS Tech with five specific pain points. Each required a different engineering response.
Challenge 1: Zero visibility.
Solution: A centralized geo-database. It should consolidate satellite, meteorological, demographic, and historical landslide data into a single decision-making platform with ETL pipelines.
Challenge 2: Disconnected stakeholders.
Solution: A unified dashboard accessible to all relevant agencies simultaneously, with role-based views. Scientists should see raw data, administrators see risk zones, field teams receive evacuation coordinates, etc.
Challenge 3: Data silos and infrastructure gaps.
Solution: A dynamic data center architecture with high-performance computing, redundant storage, and 24×7 availability. The system was built to handle multi-source data at scale without crashing during peak monsoon loads.
Challenge 4: Limited scientific modeling.
Solution: AI/ML algorithms developed to assess slope instability, rainfall thresholds, and terrain susceptibility in near real time.
Challenge 5: No standard protocols.
Solution: SCS Tech delivered standardized operational protocols (SOPs) and trained administrative-level users. They learned how to interpret, escalate, and act upon different alerts.
The Impact: A Journey From Prediction to Prevention
The impact has been measured across four dimensions.
Lives protected, losses prevented.
AI-powered early warning systems have been issued across multiple districts. It was with enough lead time to conduct evacuations, close roads, and move critical infrastructure to safer ground. Casualty reduction is the primary KPI, and the system has delivered.
360-degree situational awareness.
Planners, scientists, and response units share a single unified view for the first time. It merges topography, live weather, and vulnerability data. Decision-making is no longer fragmented.
Science-backed preparedness.
Continuous R&D is baked into the system. Rainfall thresholds are refined every season. Process-based modeling improves with every new landslide event recorded.
Smarter land use and urban planning.
Beyond immediate warnings, the accumulated data informs long-term zoning laws, infrastructure placement, and energy management in hilly regions. Preventing a disaster is better than responding to one.
Beyond Landslides: Flood Forecasting System Using the Same Architecture
The same AI + IoT + GIS stack applies directly to flood forecasting systems. The system can predict it by replacing soil sensors with river level gauges and adjusting the AI models.
Flood prediction requires upstream rainfall data, which the system already ingests from meteorological satellites. When we combine it with real-time water level sensors and topographic GIS layers, the result is a flood inundation map that updates every hour.
The Road Ahead
Climate change is making monsoon patterns more erratic. Slopes that were stable for decades are failing. Static hazard maps will never keep pace. The only sustainable path forward is real-time, AI-driven, sensor-fed early warning systems embedded directly into disaster management workflows.
SCS Tech continues to advance this field by focusing on data governance, transparency, and compliance with regulatory norms. So, don’t wait for the next disaster to test your preparedness.
Get a consultation on AI-powered early warning systems.