Category: Artificial Intelligence & Machine Learning

  • How AI & ML Are Transforming Digital Transformation in 2026

    How AI & ML Are Transforming Digital Transformation in 2026

    Digital transformation has evolved from a forward-looking strategy into a fundamental requirement for operational success. As India moves deeper into 2026, organizations across industries are recognizing that traditional digital transformation approaches are no longer enough. What truly accelerates transformation today is the integration of Artificial Intelligence (AI) and Machine Learning (ML) into core business systems.

    Unlike earlier years, where AI was viewed as an advanced technology reserved for innovation labs, it is now embedded in everyday operational workflows. Whether it’s streamlining supply chains, automating customer interactions, predicting equipment failures, or enhancing cybersecurity, AI and ML are enabling organizations to move from reactive functioning to proactive, intelligent operations.

    In this blog, we explore how AI and ML are reshaping digital transformation in 2026, what trends are driving adoption, and how enterprises in India can leverage these technologies to build a future-ready business.

    AI & ML: The Foundation of Modern Digital Transformation

    AI and ML have become the backbone of digital transformation because they allow organizations to process large amounts of data, identify patterns, automate decisions, and optimize workflows in real time. Companies are no longer implementing AI as an “optional enhancement” — instead, AI is becoming the central engine of digital operations.

    At its core, AI-powered digital transformation enables companies to achieve what previously required human intervention, multiple tools, and considerable resources. Now, tasks that once took hours or days can be completed within minutes, and with far higher accuracy.

    AI & ML empower enterprises to:

    • Improve decision-making through real-time insights

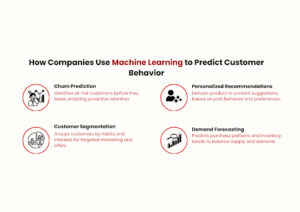
    • Understand customer behavior with greater precision

    • Optimize resources and reduce operational waste

    • Enhance productivity through intelligent automation

    • Strengthen cybersecurity using predictive intelligence

    This shift toward AI-first strategies is defining the competitive landscape in 2026.

    Key AI & ML Trends Driving Digital Transformation in 2026

    AI capabilities are expanding rapidly, and these advancements are shaping how organizations modernize their digital ecosystems. The following trends are particularly influential this year.

    a) Hyper-Automation as the New Operational Standard

    Hyper-automation integrates AI, ML, and RPA to automate complex business processes end-to-end. Organizations are moving beyond basic automation to create fully intelligent workflows that require minimal manual oversight.

    Many enterprises are using hyper-automation to streamline back-office operations, accelerate service delivery, and reduce human errors. For instance, financial services companies can now process loan applications, detect fraud, and verify customer documents with near-perfect accuracy in a fraction of the usual time.

    Businesses rely on hyper-automation for:

    • Smart workflow routing

    • Automated document processing

    • Advanced customer onboarding

    • Predictive supply chain operations

    • Real-time process optimization

    The efficiency gains are substantial, often reducing operational costs by 20–40%.

    b) Predictive Analytics for Data-Driven Decision Making

    Data is the most valuable asset of modern enterprises — but it becomes meaningful only when organizations can interpret it accurately. Predictive analytics enables businesses to forecast events, trends, and behaviors using historical and real-time data.

    In 2026, predictive analytics will be used across multiple functions. Manufacturers rely on it to anticipate machine breakdowns before they occur. Retailers use it to forecast demand fluctuations. Financial institutions apply it to assess credit risks with greater accuracy.

    Predictive analytics helps organizations:

    • Reduce downtime

    • Improve financial planning

    • Understand market movements

    • Personalize customer experiences

    • Prevent operational disruptions

    Companies that adopt predictive analytics experience greater agility and competitiveness.

    c) AI-Driven Cybersecurity and Threat Intelligence

    As organizations expand digitally, cyber threats have grown more complex. With manual monitoring proving insufficient, AI-based cybersecurity solutions are becoming essential.

    AI enhances security by continuously analyzing network patterns, identifying anomalies, and responding to threats instantly. This real-time protection helps organizations mitigate attacks before they escalate.

    AI-powered cybersecurity enables:

    • Behavioral monitoring of users and systems

    • Automated detection of suspicious activity

    • Early identification of vulnerabilities

    • Prevention of data breaches

    • Continuous incident response

    Industries such as BFSI, telecom, and government depend heavily on AI-driven cyber resilience.

    d) Intelligent Cloud Platforms for Scalability and Efficiency

    The cloud is no longer just a storage solution — it has become an intelligent operational platform. Cloud service providers now integrate AI into the core of their services to enhance scalability, security, and flexibility.

    AI-driven cloud systems can predict demand, allocate resources automatically, and detect potential failures before they occur. This results in faster applications, reduced costs, and higher reliability.

    Intelligent cloud technology supports digital transformation by enabling companies to innovate rapidly without heavy infrastructure investments.

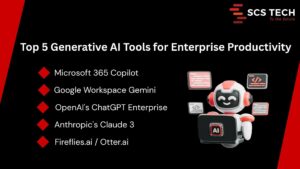
    e) Generative AI for Enterprise Productivity

    Generative AI (GenAI) has revolutionized enterprise workflows. Beyond creating text or images, GenAI now assists in tasks such as documentation, coding, research, and training.

    Instead of spending hours creating technical manuals, training modules, or product descriptions, employees can now generate accurate drafts within minutes and refine them as needed.

    GenAI enhances productivity through:

    • Automated content generation

    • Rapid prototyping and simulations

    • Code generation and debugging

    • Data summarization and analysis

    • Knowledge management

    Organizations using GenAI report productivity improvements of 35–60%.

    Generative AI Tools for Enterprise Productivity

    How AI Is Transforming Key Industries in India

    AI adoption varies across industries, but the impact is widespread and growing. Below are some sectors experiencing notable transformation.

    Healthcare

    AI is revolutionizing diagnostics, patient management, and clinical decision-making in India.
    Hospitals use AI-enabled tools to analyze patient records, medical images, and vital signs, helping doctors make faster and more accurate diagnoses.

    Additionally, predictive analytics helps healthcare providers anticipate patient needs and plan treatments more effectively. Automated hospital management systems further improve patient experience and reduce administrative workload.

    Banking & Financial Services (BFSI)

    The BFSI sector depends on AI for security, customer experience, and operational efficiency.
    Banks now use AI-based systems to detect fraudulent transactions, assess creditworthiness, automate customer service, and enhance compliance.

    With the rise of digital payments and online banking, AI enables financial institutions to maintain trust while delivering seamless customer experiences.

    Manufacturing

    Manufacturers in India are integrating AI into production lines, supply chain systems, and equipment monitoring.
    AI-driven predictive maintenance significantly reduces downtime, while computer vision tools perform real-time quality checks to maintain consistency across products.

    Digital twins — virtual replicas of physical systems — allow manufacturers to test processes and optimize performance before actual deployment.

    Retail & E-Commerce

    AI helps retail companies understand customer preferences, forecast demand, manage inventory, and optimize pricing strategies.
    E-commerce platforms use AI-powered recommendation engines to deliver highly personalized shopping experiences, leading to higher conversion rates and increased customer loyalty.

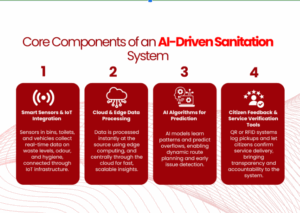
    Government & Smart Cities

    Smart city initiatives across India use AI for traffic management, surveillance, GIS mapping, and incident response.
    Government services are becoming more citizen-friendly by automating workflows such as applications, approvals, and public queries.

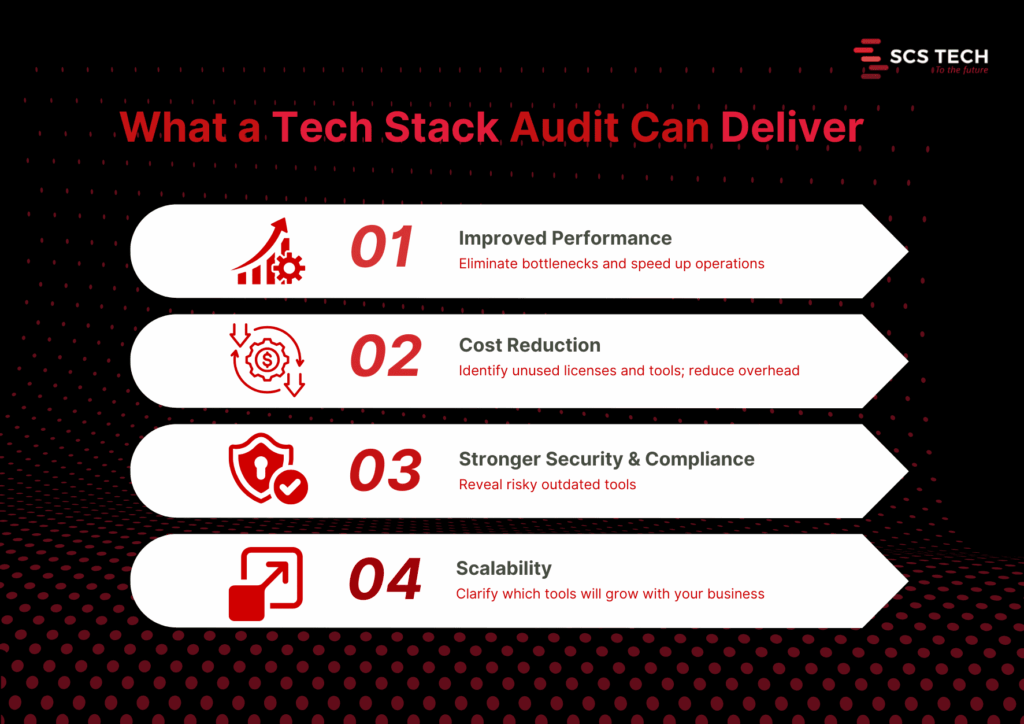
    Benefits of AI & ML in Digital Transformation

    AI brings measurable improvements across multiple aspects of business operations.

    Key benefits include:

    • Faster and more accurate decision-making

    • Higher productivity through automation

    • Reduction in operational costs

    • Enhanced customer experiences

    • Stronger security and risk management

    • Increased agility and innovation

    These advantages position AI-enabled enterprises for long-term success.

    Challenges Enterprises Face While Adopting AI

    Despite its potential, AI implementation comes with challenges.

    Common barriers include:

    • Lack of AI strategy or roadmap

    • Poor data quality or fragmented data

    • Shortage of skilled AI professionals

    • High initial implementation costs

    • Integration issues with legacy systems

    • Concerns around security and ethics

    Understanding these challenges helps organizations plan better and avoid costly mistakes.

    How Enterprises Can Prepare for AI-Powered Transformation

    Organizations must take a structured approach to benefit fully from AI.

    Steps to build AI readiness:

    • Define a clear AI strategy aligned with business goals

    • Invest in strong data management and analytics systems

    • Adopt scalable cloud platforms to support AI workloads

    • Upskill internal teams in data science and automation technologies

    • Start small—test AI in pilot projects before enterprise-wide rollout

    • Partner with experienced digital transformation providers

    A guided, phased approach minimizes risks and maximizes ROI.

    Why Partner with SCS Tech India for AI-Led Digital Transformation?

    SCS Tech India is committed to helping organizations leverage AI to its fullest potential. With expertise spanning digital transformation, AI/ML engineering, cybersecurity, cloud technology, and GIS solutions, the company delivers results-driven transformation strategies.

    Organizations choose SCS Tech India because of:

    • Proven experience across enterprise sectors

    • Strong AI and ML development capabilities

    • Scalable and secure cloud and data solutions

    • Deep expertise in cybersecurity

    • Tailored transformation strategies for each client

    • A mature, outcome-focused implementation approach

    Whether an enterprise is beginning its AI journey or scaling across departments, SCS Tech India provides end-to-end guidance and execution.

    Wrapping Up!

    AI and Machine Learning are redefining what digital transformation means in 2026. These technologies are enabling organizations to move faster, work smarter, and innovate continuously. Companies that invest in AI today will lead their industries tomorrow.

    Digital transformation is no longer just about adopting new technology — it’s about building an intelligent, agile, and future-ready enterprise. With the right strategy and partners like SCS Tech India, businesses can unlock unprecedented levels of efficiency, resilience, and growth.

  • How Companies Are Using Machine Learning to Predict Customer Behavior

    How Companies Are Using Machine Learning to Predict Customer Behavior

    Ever wish you could predict what your customers will do next? Which products they’ll buy, when they might churn, or how they’ll respond to a promotion? Companies today are turning to machine learning (ML) to do exactly that. By analyzing historical data and identifying patterns, ML helps businesses anticipate behavior, make smarter decisions, and drive growth.

    Industry studies show measurable gains from ML-driven customer analytics: academic reviews and industry case studies report retention improvements in the 5–10% range for organizations that adopt advanced churn prediction, while personalization and recommendation efforts commonly deliver single-digit to mid-teens percentage lifts in revenue.

    This shows that predictive analytics isn’t just a buzzword, it’s a measurable driver of business performance.

    Understanding Machine Learning in Customer Behavior Prediction

    Machine learning uses algorithms to find patterns in past customer behavior and make predictions about the future. Unlike traditional analytics, which might tell you what happened, ML predicts what is likely to happen and why.

    Some key concepts to keep in mind:

    • Historical data analysis – ML models ingest large datasets, such as transaction history, browsing behavior, and engagement metrics, to identify trends.
    • Pattern recognition – By detecting correlations and recurring patterns, ML can predict outcomes such as the likelihood of a customer churning or responding to a marketing campaign.
    • Continuous learning – Models improve over time as more data flows in, increasing prediction accuracy. For example, retailers using ML for demand forecasting typically see substantial inventory improvements—industry analyses report inventory reductions of roughly 20–30% and meaningful cuts in stockouts in many implementations.

    Machine learning in customer behavior prediction allows businesses to move from reactive decision-making to proactive strategies, giving a measurable edge in retention, personalization, and revenue growth.

    Key Applications of ML for Customer Behavior

    Machine learning isn’t just a futuristic concept, it’s already driving tangible results across multiple customer-facing areas. From reducing churn to personalizing experiences, ML helps companies turn data into actionable insights that improve retention, increase revenue, and optimize operations.

    Churn Prediction – Identifying At-Risk Customers Before They Leave

    Losing a customer can be expensive. Studies estimate that acquiring a new customer costs 5–25 times more than retaining an existing one. That’s where ML-powered churn prediction comes in. By analyzing customer interactions, purchase patterns, and engagement metrics, ML models can flag at-risk customers before they disengage.

    For example:

    • A subscription service might predict which users are likely to cancel based on declining usage patterns or negative support interactions.
    • Retailers can identify customers who haven’t purchased in the last 60 days and target them with personalized incentives.

    Using these insights, companies can proactively intervene, offering personalized retention campaigns, discounts, or engagement strategies. An academic systematic review supports the 5–10% retention range; some vendor case studies show higher numbers (15–20%), so I preserved both facts by citing the academic range and noting larger vendor results.

    Personalized Recommendations – Driving Engagement and Upsells

    Customers expect experiences tailored to their needs. Machine learning enables companies to deliver personalized recommendations by analyzing past behavior, preferences, and interactions. This follows the relevance principle, where suggestions aligned with user intent increase the likelihood of engagement and purchase.

    For example:

    • E-commerce platforms use ML to suggest products based on browsing history and purchase patterns, boosting average order value.
    • Streaming services recommend content tailored to individual viewing habits, increasing watch time and subscription retention.

    The results are measurable: companies implementing ML-based recommendation engines often see 10–30% higher conversion rates and 15–25% more revenue per user. Beyond revenue, personalization strengthens customer loyalty, turning one-time buyers into repeat customers.

    By automatically analyzing patterns and predicting preferences, ML transforms marketing and sales from a one-size-fits-all approach into a data-driven, hyper-relevant experience for each customer.

    Customer Segmentation – Grouping Customers by Behavior and Preferences

    Not all customers are the same, and treating them that way wastes opportunities. Machine learning helps companies segment customers based on behavior, preferences, and engagement patterns, enabling more precise marketing and product strategies.

    For example:

    • A retailer can group customers by purchase frequency, product preferences, and browsing patterns to target promotions effectively.
    • A SaaS company can identify high-value, high-churn-risk, and inactive users, tailoring communication and retention efforts accordingly.

    Data-driven customer segmentation typically improves marketing efficiency—analysts and vendor reports commonly document mid-single-digit to low-double-digit uplift in revenue or ROI from better targeting, with larger gains in well-executed, hyper-personalized programs.

    Using these data-driven groups, teams can deliver the right message to the right customer at the right time, improving engagement, loyalty, and overall revenue.

    Segmentation powered by ML moves businesses away from assumptions and guesses, enabling actionable insights that guide decision-making across marketing, sales, and product teams.

    Demand Forecasting – Predicting Purchase Patterns and Inventory Needs

    Running out of stock or holding excess inventory can be costly. Machine learning helps companies predict demand patterns by analyzing historical sales, seasonal trends, and customer behavior. This follows the supply-demand alignment model, where accurate predictions reduce both lost sales and overstock costs.

    For example:

    • Retailers can forecast which products will sell faster during peak seasons and adjust inventory proactively.
    • E-commerce platforms can predict the demand for new product launches based on similar items and user behavior.

    Companies using ML for demand forecasting commonly report double-digit improvements in inventory efficiency—analysts estimate inventory level reductions of ~20–30% in many cases and meaningful decreases in stockouts across deployments. By integrating predictive insights into purchasing and production decisions, ML allows businesses to plan smarter, respond faster, and meet customer demand without unnecessary waste.

    Steps Companies Take to Implement ML for Customer Behavior

    To effectively leverage machine learning for predicting customer behavior, companies follow a structured approach that turns raw data into actionable insights. When implemented correctly, ML doesn’t just reveal patterns, it guides smarter decisions across marketing, sales, and product teams, improving engagement, retention, and revenue.

    Key steps include:

    • Collect and clean customer data – Consolidate information from CRM systems, transactions, website interactions, and engagement metrics, ensuring accuracy and completeness.
    • Train ML models and validate predictions – Use historical data to build models that forecast churn, purchase likelihood, or preferences, and test them to ensure reliability.
    • Integrate insights into business processes – Apply predictions to marketing campaigns, sales strategies, and product planning for proactive decision-making.
    • Continuous monitoring and refinement – Track model performance, retrain as needed, and incorporate feedback to adapt to evolving customer behavior.

    By following these steps, companies can move from reactive decision-making to a proactive, data-driven approach, anticipating customer needs and optimizing strategies in real time.

    Conclusion

    Predicting customer behavior with artificial intelligence and machine learning isn’t just a technical advantage, it’s a strategic necessity in today’s data-driven business landscape. By identifying at-risk customers, delivering personalized recommendations, segmenting audiences, and forecasting demand, companies can make smarter decisions, increase engagement, and drive measurable growth.

    At SCSTech, we specialize in helping businesses harness the power of machine learning to understand and anticipate customer behavior. Our experts work closely with you to design, implement, and optimize ML solutions that turn data into actionable insights, helping your teams stay ahead of trends and make proactive decisions.

    Contact our experts at SCSTech today to explore how machine learning can transform the way your company predicts customer behavior and drives business results.

  • Blockchain Applications in Supply Chain Transparency with IT Consultancy

    Blockchain Applications in Supply Chain Transparency with IT Consultancy

    The majority of supply chains use siloed infrastructures, unverifiable paper records, and multi-party coordination to keep things moving operationally. But as regulatory requirements become more stringent and source traceability is no longer optional, such traditional infrastructure is not enough without the right IT consultancy support.

    Blockchain fills this void by creating a common, tamper-evident layer of data that crosses suppliers, logistics providers, and regulatory authorities, yet does not replace current systems.

    This piece examines how blockchain technology is being used in actual supply chain settings to enhance transparency where traditional systems lack.

    Why Transparency in Supply Chains Is Now a Business Imperative

    Governments are making it mandatory. Investors are requiring it. And operational risks are putting into the spotlight firms that lack it. A digital transformation consultant can help organizations navigate these pressures, as supply chain transparency has shifted from a long-term aspiration to an instant priority.

    Here’s what’s pushing the change:

    • Regulations worldwide are getting stricter quickly. The Corporate Sustainability Due Diligence Directive (CSDDD) from the European Union will require large companies to monitor and report on. Environmental and Human Rights harm within their supply chains. If a company is found to be in contravention of the legislation, the fine could be up to 5% of global turnover.
    • Uncertainty about supply chains carries significant financial and reputational exposure.
    • Today’s consumers want assurance. Consumers increasingly want proof of sourcing, whether it be “organic,” “conflict-free,” or “fair trade.” Greenwashing or broad assurances will no longer suffice.

    Blockchain’s Role in Transparency of Supply Chains

    Blockchain is designed to address a key weakness of modern supply chains, however. The reality of fragmented systems, vendors, and borders is a lack of end-to-end visibility. 

    Here’s how it delivers that transparency in practice:

    1. Immutable Records at Every Step

    Each transaction, whether it’s raw material sourcing, shipping, or quality checks is logged as a permanent, timestamped entry.

    No overwriting. No backdating. No selective visibility. Every party sees a shared version of the truth.

    2. Real-Time Traceability

    Blockchain lets you track goods as they move through each checkpoint, automatically updating status, location, and condition. This prevents data gaps between systems and reduces time spent chasing updates from vendors.

    3. Supplier Accountability

    When records are tamper-proof and accessible, suppliers are less likely to cut corners.

    It’s no longer enough to claim ethical sourcing; blockchain makes it verifiable, down to the certificate or batch.

    4. Smart Contracts for Rule Enforcement

    Smart contracts automate enforcement:

    • Was the shipment delivered on time?
    • Did all customs documents clear?

    If not, actions can trigger instantly, with no manual approvals or bottlenecks.

    5. Interoperability Across Systems

    Blockchain doesn’t replace your ERP or logistics software. Instead, it bridges them, connecting siloed systems into a single, auditable record that flows across the supply chain.

    From tracking perishable foods to verifying diamond origins, blockchain has already proven its role in cleaning up opaque supply chains with results that traditional systems couldn’t match.

    Real-World Applications of Blockchain in Supply Chain Tracking

    Blockchain’s value in supply chains is being applied in industries where source verification, process integrity, and document traceability are non-negotiable. Below are real examples where blockchain has improved visibility at specific supply chain points.

    1. Food Traceability — Walmart & IBM Food Trust

    Challenge: Tracing food origins during safety recalls used to take Walmart 6–7 days, leaving a high contamination risk.

    Application: By using IBM’s blockchain platform, Walmart reduced trace time to 2.2 seconds.

    Outcome: This gives its food safety team near-instant visibility into the supply path, lot number, supplier, location, and temperature history, allowing faster recalls with less waste.

    2. Ethical Sourcing — De Beers with Tracr

    Challenge: Tracing diamonds back to ensure they are conflict-free has long relied on easily forged paper documents.

    Application: De Beers applied Tracr, a blockchain network that follows each diamond’s journey from mine to consumer.

    Outcome: Over 1.5 million diamonds are now digitally certified, with independently authenticated information for extraction, processing, and sale. This eliminates reliance on unverifiable supplier assurances.

    3. Logistics Documentation — Maersk’s TradeLens

    Challenge: Ocean freight involves multiple handoffs, ports, customs, and shippers, each using siloed paper-based documents, leading to fraud and delays.

    Application: Maersk and IBM launched TradeLens, a blockchain platform connecting over 150 participants, including customs authorities and ports.

    Outcome: Shipping paperwork is now in alignment among stakeholders near real-time, reducing delays and administrative charges in world trade.

    All of these uses revolve around a specific point of supply chain breakdown, whether that’s trace time, trust in supplier data, or document synchronisation. Blockchain does not solve supply chains in general. It solves traceability when systems, as they exist, do not.

    Business Benefits of Using Blockchain for Supply Chain Visibility

    For teams responsible for procurement, logistics, compliance, and supplier management, blockchain doesn’t just offer transparency; it simplifies decision-making and reduces operational friction.

    Here’s how:

    • Speedier vendor verification: Bringing on a new supplier no longer requires weeks of documentation review. With blockchain, you have access to pre-validated certifications, transaction history, and sourcing paths, already logged and transferred.
    • Live tracking in all tiers: No more waiting for updates from suppliers. You can follow product movement and status changes in real-time, from raw material to end delivery through every tier in your supply chain.
    • Less paper documentation: Smart contracts eliminate unnecessary paper documentation on shipment, customs clearance, and vendor pay. Less time reconciling data between systems, fewer errors, and no conflicts.
    • Better readiness for audits: When an audit comes or a regulation changes, you are not panicking. Your sourcing and shipping information is already time-stamped and locked in place, ready to be reviewed without cleanup.
    • Lower dispute rates with suppliers: Blockchain prevents “who said what” situations. When every shipment, quality check, and approval is on-chain, accountability is the default.
    • More consumer-facing claims: If sustainability is the core of your business, ethical sourcing, or authenticity of products, blockchain allows you to validate it. Instead of saying it, you show the data to support it.

    Conclusion 

    Blockchain evolved from a buzzword to an underlying force for supply chain transparency. And yet to introduce it into actual production systems, where vendors, ports, and regulators still have disconnected workflows, is not a plug-and-play endeavor—this is where expert IT consultancy becomes essential.

    That’s where SCS Tech comes in.

    We support forward-thinking teams, SaaS providers, and integrators with custom-built blockchain modules that slot into existing logistics stacks, from traceability tools to permissioned ledgers that align with your partners’ tech environments.

    FAQs 

    1. If blockchain data is public, how do companies protect sensitive supply chain details?

    Most supply chain platforms use permissioned blockchains, where only authorized participants can access specific data layers. You control what’s visible to whom, while the integrity of the full ledger stays intact.

    2. Can blockchain integrate with existing ERP or logistics software?

    Yes. Blockchain doesn’t replace your systems; it connects them. Through APIs or middleware, it links ERP, WMS, or customs tools so they share verified records without duplicating infrastructure.

    3. Is blockchain only useful for high-value or global supply chains?

    Not at all. Even regional or mid-scale supply chains benefit, especially where supplier verification, product authentication, or audit readiness are essential. Blockchain works best where transparency gaps exist, not just where scale is massive.

  • AI-Driven Smart Sanitation Systems in Urban Areas

    AI-Driven Smart Sanitation Systems in Urban Areas

    Urban sanitation management at scale needs something more than labor and fixed protocols. It calls for systems that can dynamically respond to real-time conditions, bin status, public cleanliness, route efficiency, and service accountability.

    That’s where AI-based sanitation enters the picture. Designed on sensor information, predictive models, and automation, these systems are already deployed in Indian cities to minimize waste overflow, optimize collection, and enhance public health results.

    This article delves into how these systems function, the underlying technologies that make them work, and why they’re becoming critical infrastructure for urban service providers and solution makers.

    What Is an AI-Driven Sanitation System?

    An AI sanitation system uses artificial intelligence to improve monitoring, management, and collection of urban waste. In contrast to traditional buildings that rely on pre-programmed schedules and visual checking, this system works by gathering real-time data from the ground and making more informed decisions based on it.

    Smart sensors installed in waste bins or street toilets detect fill levels, foul odours, or cleaning needs. This is transmitted to a central platform, where machine learning techniques scan patterns, e.g., how fast waste fills up in specific zones or where overflows are most likely to occur. From this, the system can automate alarms, streamline waste collection routes, and assist city staff in taking action sooner.

    Core Technologies That Power Smart Sanitation in Cities

    The development of a smart sanitation system begins with the knowledge of how various technologies converge to monitor, analyze, and react to conditions of waste in real time. Such systems are not isolated; they exist as an ecosystem.

    This is how the main pieces fit together:

    1. Smart Sensors and IoT Integration

    Sanitation systems depend on ultrasonic sensors, smell sensors, and environmental sensors placed in bins, toilets, and trucks. They monitor fill levels, gas release (such as ammonia or hydrogen sulfide), temperature, and humidity. Placed throughout a city once installed, they become the sensory layer, sensing the changes way before human inspections would.

    Each sensor is linked using Internet of Things (IoT) infrastructure, which permits the data to run continuously to a processing platform. Such sensors have been installed in more than 350 public toilets by cities like Indore to track hygiene in real-time.

    2. Cloud and Edge Data Processing

    Data must be acted upon as soon as it is captured. This is done with cloud-based analytics coupled with edge computing, which processes data close to the source. These layers enable data to be cleansed, structured, and organized in order to be understandably presented to AI. 

    This blend is capable of taking even high-volume, dispersed data from thousands of bins or collection vehicles and aggregating it with little latency and maximum availability.

    3. AI Algorithms for Prediction and Optimization

    This is the layer of intelligence. We develop machine learning models based on both historical and real-time data to understand at what times bins are likely to overflow, what areas will generate waste above the anticipated threshold, and how to reduce time and fuel in collection routes.

    In a recent research, the cities that adopted AI-driven route planning experienced over 28% decrease in collection time and over 13% reduction in costs against manual scheduling models.

    4. Citizen Feedback and Service Verification Tools

    Several systems also comprise QR code or RFID-based monitoring equipment that records every pickup and connects it to a particular home or stop. Residents can check if their bins were collected or report if they were not. Service accountability is enhanced, and governments have an instant service quality dashboard.

    Door-to-door waste collection in Ranchi, for instance, is now being tracked online, and contractors risk penalties for missed collections.

    These technologies operate optimally when combined, but as part of an integrated, AI-facilitated infrastructure. That’s what makes a sanitation setup a clever, dynamic city service.

    How Cities Are Already Using AI for Sanitation

    Many Indian cities are past pilot projects and, in effect, use it to rectify real, operational inefficiencies. 

    These examples indicate how AI is not simply a bag of data, but the data is being utilized for decision-making, problem-solving, and enhancing effectiveness on the ground.

    1. Real-Time Hygiene Monitoring

    Indore, one of India’s top-ranking cities under Swachh Bharat, has installed smart sensors in over 350 public toilets. These sensors monitor odour levels, air quality, water availability, and cleaning frequency.

    What is salient is not the sensors, but how the city is utilizing that data. Staff cleaning units, for example, get automated alerts when conditions fall below the city’s set thresholds (e.g., hours of rain), and instead of acting on expected days of service, they are doing services on need-derived data; used less water and improved experience.

    This is where AI plays its role, learning usage patterns over time and helping optimize cleaning cycles, even before complaints arise.

    2. Transparent Waste Collection

    Jharkhand has implemented QR-code and RFID-based tracking systems for doorstep waste collection. Every household pickup is electronically recorded, giving rise to a verifiable chain of service history.

    But AI kicks in when patterns start to set in. If specific routes have regularly skipped pickups, or if the frequency of collection falls below desired levels, the system can highlight irregularities and impose penalties on contractors.

    This type of transparency enables improved contract enforcement, resource planning, and public accountability, key issues in traditional sanitation systems.

    3. Fleet Optimization and Air Quality Goals

    In Lucknow, the municipal corporation introduced over 1,250 electric collection vehicles and AI-assisted route planning to reduce delays and emissions.

    While the shift to electric vehicles is visible, the invisible layer is where the real efficiency comes in. AI helps plan which routes need what types of vehicles, how to avoid congestion zones, and where to deploy sweepers more frequently based on dust levels and complaint data.

    The result? Cleaner streets, reduced PM pollution, and better air quality scores, all tracked and reported in near real-time.

    From public toilets to collection fleets, cities across India are using AI to respond faster, act smarter, and serve better, without adding manual burden to already stretched civic teams.

    Top Benefits of AI-Enabled Sanitation Systems for Urban Governments

    When sanitation systems start responding to real-time data, governments don’t just clean cities more efficiently; they run them more intelligently. AI brings visibility, speed, and structure to what has traditionally been a reactive and resource-heavy process.

    Here’s what that looks like in practice:

    • Faster issue detection and resolution – Know the problem before a citizen reports it, whether it’s an overflowing bin or an unclean public toilet.
    • Cost savings over manual operations – Reduce unnecessary trips, fuel use, and overstaffing through route and task optimization.
    • Improved public hygiene outcomes – Act on conditions before they create health risks, especially in dense or underserved areas.
    • Better air quality through cleaner operations – Combine electric fleets with optimized routing to reduce emissions in high-footfall zones.
    • Stronger Swachh Survekshan and ESG scores – Gain national recognition and attract infrastructure incentives by proving smart sanitation delivery.

    Conclusion

    Artificial intelligence is already revolutionizing the way urban sanitation is designed, delivered, and scaled. But for organizations developing these solutions, speed and flexibility are just as important as intelligence.

    Whether you are creating sanitation technology for city bodies or incorporating AI into your current civic services, SCSTech assists you in creating more intelligent systems that function in the field, in tune with municipal requirements, and deployable immediately. Reach out to us to see how we can assist with your next endeavor.

    FAQs

    1. How is AI different from traditional automation in sanitation systems?

    AI doesn’t just automate fixed tasks; it uses real-time data to learn patterns and predict needs. Unlike rule-based automation, AI can adapt to changing conditions, forecast bin overflows, and optimize operations dynamically, without needing manual reprogramming each time.

    2. Can small to mid-size city projects afford to have AI in sanitation?

    Yes. With scalable architecture and modular integration, AI-based sanitation solutions can be tailored to suit various project sizes. Most smart city vendors today use phased methods, beginning with the essential monitoring capabilities and adding full-fledged AI as budgets permit.

    3. What kind of data is needed to make an AI sanitation system work effectively?

    The system relies on real-time data from sensors, such as bin fill levels, odour detection, and GPS tracking of collection vehicles. Over time, this data helps the AI model identify usage patterns, optimize routes, and predict maintenance needs more accurately.

  • How to Audit Your Existing Tech Stack Before Starting a Digital Transformation Project

    How to Audit Your Existing Tech Stack Before Starting a Digital Transformation Project

    Before you begin any digital transformations, you need to see what you’ve got. Most teams are using dozens of tools throughout their departments, and for the most part, they are underutilized, do not connect with one another, or are not in alignment with the current objectives. 

    The tech stack audit is what helps you identify your tools, how they fit together, and where you have gaps or threats. If you haven’t done this process, even the best digital plans can wilt due to slowdowns, increased expenses, or breaches of security.

    This guide guides you step-by-step in how to do an audit of your stack properly, so your digital transformation starts from a good foundation, not with new software.

    What Is a Tech Stack Audit?

    A tech stack audit reviews all the software, platforms, and integrations being used in your business. It checks how well these components integrate, how well they execute, and how they align with your digital transformation goals.

    A fragmented or outdated stack can slow progress and increase risk. According to Struto, outdated or incompatible tools “can hinder performance, compromise security, and impede the ability to scale.”

    Poor data, redundant tools, and technical debt are common issues. Poor team morale and inefficiencies ensue, according to Brightdials, as stacks become unstructured or unmaintained.

    Core benefits of a thorough audit

    1. Improved performance. Audits reveal system slowdowns and bottlenecks. Fixing them can lead to faster response times and higher user satisfaction. Streamlining outdated systems through tech digital solutions can unlock performance gains that weren’t previously possible.
    2. Cost reduction. You may discover unneeded licenses, redundant software, or shadow IT. One firm saved $20,000 annually after it discovered a few unused tools.
    3. Improved security and compliance. Auditing reveals stale or exposed pieces. It avoids compliance mistakes and reduces the attack surface.
    4. Better scalability and future-proofing. An audit shows what tools will be scalable with growth or need to be replaced before new needs drive them beyond their usefulness.

    Step-by-Step Process to Conduct a Tech Stack Audit

    It is only logical to understand what you already have and how well it is working before you begin any digital transformation program. The majority of organizations go in for new tools and platforms without checking their current systems properly. That leads to problems later on.

    A systematic tech stack review makes sense. It will inform you about what to keep, what to phase out, and what to upgrade. More importantly, it ensures your transformation isn’t based on outdated, replicated, or fragmented systems.

    The following is the step-by-step approach we suggest, in the way that we assist teams in getting ready for effective, low-risk digital transformation.

    Step 1: Create a Complete Inventory of Your Tech Stack

    Start by listing every tool, platform, and integration your organization currently uses. This includes everything from your core infrastructure (servers, databases, CRMs, ERPs) to communication tools, collaboration apps, third-party integrations, and internal utilities developed in-house.

    And it needs to be complete, not skimpy.

    Go by department or function. So:

    • Marketing may be employing an email automation tool, a customer data platform, social scheduling apps, and analytics dashboards.
    • Sales can have CRM, proposal tools, contract administration, and billing integration.
    • Operations can have inventory platforms, scheduling tools, and reporting tools.
    • IT will deal with infrastructure, security, endpoint management, identity access, and monitoring tools.

    Also account for:

    • Licensing details: Is the tool actively paid for or in trial phase?
    • Usage level: Is the team using it daily, occasionally, or not at all?
    • Ownership: Who’s responsible for managing the tool internally?
    • Integration points: Does this tool connect with other systems or stand alone?

    Be careful to include tools that are rarely talked about, like those used by one specific team, or tools procured by individual managers outside of central IT (also known as shadow IT).

    A good inventory gives you visibility. Without it, you will probably go about attempting to modernize against tools that you didn’t know were still running or lose the opportunity to consolidate where it makes sense.

    We recommend keeping this inventory in a shared spreadsheet or software auditing tool. Keep it up to date with all stakeholders before progressing to the next stage of the audit. This is often where a digital transformation consultancy can provide a clear-eyed perspective and structured direction.

    Step 2: Evaluate Usage, Cost, and ROI of Each Tool

    Having now made a list of all tools, the next thing is to evaluate if each one is worth retaining. This involves evaluating three things: how much it is being used, its cost, and what real value it provides.

    Start with usage. Talk to the teams who are using each one. Is it part of their regular workflow? Do they use one specific feature or the whole thing? If adoption is low or spotty, it’s a flag to go deeper. Teams tend to stick with a tool just because they know it, more than because it’s the best option.

    Then consider the price. That is the direct cost, such as subscription, license, and renewal. But don’t leave it at that. Add concealed costs: support, training, and the time wasted on troubleshooting. Two resources might have equal initial costs, but the resource that delays or requires constant aid has a higher cost.

    Last but not least, emphasize ROI. This is usually the neglected section. A tool might be used extensively and cheaply, yet it does not automatically mean it performs well. Ask:

    • Does it help your team accomplish objectives faster?
    • Has efficiency or manual labor improved?
    • Has an impact been made that can be measured, e.g., faster onboarding, better customer response time, or cleaner data?

    You don’t need complex math for this—just simple answers. If a tool is costing more than it returns or if a better alternative exists, it must be tagged for replacement, consolidation, or elimination.

    A digital transformation consultant can help you assess ROI with fresh objectivity and prevent emotional attachment from skewing decisions. This ensures that your transformation starts with tools that make progress and not just occupy budget space.

    Step 3: Map Data Flow and System Integrations

    Start by charting how data moves through your systems. How does it begin? Where does it go next? What devices send or receive data, and in what format? This is to pull out the form behind your operations, customer journey, reporting, collaboration, automation, etc.

    Break it up by function:

    • Is your CRM feeding back to your email system?
    • Is your ERP pumping data into inventory or logistics software?
    • How is data from customer support synced with billing or account teams?

    Map these flows visually or in a shared document. List each tool, the data it shares, where it goes, and how (manual export, API, middleware, webhook, etc.).

    While doing this, ask the following:

    • Are there any manual handoffs that slow things down or increase errors?
    • Do any of your tools depend on redundant data entry?
    • Are there any places where data needs to flow but does not?
    • Are your APIs solid, or are they perpetually patch-pending to keep working?

    This step tends to reveal some underlying problems. For instance, a tool might seem valuable when viewed in a vacuum but fails to integrate properly with the remainder of your stack, slowing teams down or building data silos.

    You’ll also likely find tools doing similar jobs in parallel, but not communicating. In those cases, either consolidate them or build better integration paths.

    The point here isn’t merely to view your tech stack; it’s to view how integrated it is. Uncluttered, reliable data flows are one of the best indications that your company is transformation-ready.

    Step 4: Identify Redundancies, Risks, and Outdated Systems

    With your tools and data flow mapped out, look at what is stopping you.

    • Start with redundancies. Do you have more than one tool to fix the same problem? If two systems are processing customer data or reporting, check to see if both are needed or if it is just a relic of an old process.
    • Scan for threats second. Tools that are outdated or tools that are no longer supported by their vendors can leave vulnerabilities. So can systems that use manual operations to function. When a tool fails and there is no defined failover, it’s a threat.
    • Then, assess for outdated systems. These are platforms that don’t integrate well, slow down teams, or can’t scale with your growth plans. Sometimes, you’ll find legacy tools still in use just because they haven’t been replaced, yet they cost more time and money to maintain.

    All of these duplicative, risky, or outdated, demands a decision: sunset it, replace it, or redefine its use. It is done now to avoid complexity in future transformation.

    Step 5: Prioritize Tools to Keep, Replace, or Retire

    With your results from the audit in front of you, sort each tool into three boxes:

    • Keep: In current use, fits well, aids current and future goals.
    • Misaligned, too narrow in scope, or outrun by better alternatives.
    • Retire: Redundant, unused, or imposes unnecessary cost or risk.

    Make decisions based on usage, ROI, integration, and team input. The simplicity of this method will allow you to build a lean, focused stack to power digital transformation without bringing legacy baggage into the future. Choosing the right tech digital solutions ensures your modernization plan aligns with both technical capability and long-term growth.

    Step 6: Build an Action Plan for Tech Stack Modernization

    Use your audit findings to give clear direction. Enumerate what must be implemented, replaced, or phased out with responsibility, timeline, and cost.

    Split it into short- and long-term considerations.

    • Short-term: purge unused tools, eliminate security vulnerabilities, and build useful integrations.
    • Long-term: timeline for new platforms, large migrations, or re-architected markets.

    This is often the phase where a digital transformation consultant can clarify priorities and keep execution grounded in ROI.

    Make sure all stakeholders are aligned by sharing the plan, assigning the work, and tracking progress. This step will turn your audit into a real upgrade roadmap ready to drive your digital transformation.

    Step 7: Set Up a Recurring Tech Stack Audit Process

    An initial audit is useful, but it’s not enough. Your tools will change. Your needs will too.

    Creating a recurring schedule to examine your stack every 6 or 12 months is suitable for most teams. Use the same checklist: usage, cost, integration, performance, and alignment with business goals.

    Make someone in charge of it. Whether it is IT, operations, or a cross-functional lead, consistency is the key.

    This allows you to catch issues sooner, and waste less, while always being prepared for future change, even if it’s not the change you’re currently designing for.

    Conclusion

    A digital transformation project can’t succeed if it’s built on top of disconnected, outdated, or unnecessary systems. That’s why a tech stack audit isn’t a nice-to-have; it’s the starting point. It helps you see what’s working, what’s getting in the way, and what needs to change before you move forward.

    Many companies turn to digital transformation consultancy at this stage to validate their findings and guide the next steps.

    By following a structured audit process, inventorying tools, evaluating usage, mapping data flows, and identifying gaps, you give your team a clear foundation for smarter decisions and smoother execution.

    If you need help assessing your current stack, a digital transformation consultant from SCSTech can guide you through a modernization plan. We work with companies to align technology with real business needs, so tools don’t just sit in your stack; they deliver measurable value. With SCSTech’s expertise in tech digital solutions, your systems evolve into assets that drive efficiency, not just cost.

  • LiDAR vs Photogrammetry: Which One Is Right for Your GIS Deployment?

    LiDAR vs Photogrammetry: Which One Is Right for Your GIS Deployment?

    Both LiDAR and photogrammetry offer the accuracy of spatial data, yet that doesn’t simplify the choice. They fulfill the same function in GIS implementations but do so with drastically different technologies, expenses, and conditions in the field. LiDAR provides laser accuracy, as well as canopy penetration; photogrammetry provides high-resolution visuals, as well as velocity. However, selecting one without knowing where it will succeed or fail means the investment is wasted or the data is compromised.

    Choosing the right technology also directly impacts the success of your GIS services, especially when projects are sensitive to terrain, cost, or delivery timelines.

    This article compares them head-to-head across real-world factors: mapping accuracy, terrain adaptability, processing time, deployment requirements, and cost. You’ll see where one outperforms the other and where a hybrid approach might be smarter.

    LiDAR vs Photogrammetry: Key Differences

    LiDAR and photogrammetry are two of GIS’s most popular techniques for gathering spatial data. Both are intended to record real-world environments but do so in dramatically different manners.

    LiDAR (Light Detection and Ranging) employs laser pulses to estimate distances between a sensor and targets on the terrain. These pulses bounce back towards the sensor to form accurate 3D point clouds. It is functional in many light environments and can even scan through vegetation to map the ground.

    Photogrammetry, however, utilizes overlapping photographs taken from cameras, usually placed on drones or airplanes. These photos are then computer-processed to construct the shape and location of objects in 3D space. It is greatly dependent on favorable lighting and open visibility to produce good results.

    Both methods are supportive of GIS mapping, although one might be more beneficial than the other based on project needs. Here’s where they vary in terms of principal differences:

    • Accuracy in GIS Mapping
    • Terrain Suitability & Environmental Conditions
    • Data Processing & Workflow Integration
    • Hardware & Field Deployment
    • Cost Implications

    Accuracy in GIS Mapping

    When your GIS implementation is contingent upon accurate elevation and surface information, applications such as flood modeling, slope analysis, or infrastructure planning, the quality of your data collection means the project makes it or breaks it.

    LiDAR delivers strong vertical accuracy thanks to laser pulse measurements. Typical airborne LiDAR surveys achieve vertical RMSE (Root Mean Square Error) between 5–15 cm, and in many cases under 10 cm, across various terrain types. Urban or infrastructure-focused LiDAR (like mobile mapping) can even get vertical RMSE down to around 1.5 cm.

    Photogrammetry, on the other hand, provides less accurate vertical accuracy. Generally, most good-quality drone photogrammetry is able to produce around 10–50 cm RMSE in height, although horizontal accuracy is usually 1–3 cm. Tighter vertical accuracy is more difficult to achieve and requires more ground control points, improved image overlap, and good lighting, all require more money and time.

    For instance, an infrastructure corridor that must be accurately elevated to plan drainage may be compromised by photogrammetry alone. A LiDAR survey would be sure to collect the small gradients required for good water flow or grading design, however.

    • Use LiDAR when vertical accuracy is critical, for elevation modeling, flood risk areas, or engineering requirements.
    • Use photogrammetry for horizontal mapping or visual base layers where small elevation errors are acceptable and the cost is a constraint.

    These distinctions are particularly relevant when planning GIS in India, where both urban infrastructure and rural landscapes present diverse elevation and surface data challenges.

    Terrain Suitability & Environmental Conditions

    Choosing between LiDAR and photogrammetry often comes down to the terrain and environmental conditions where you’re collecting data. Each method responds differently based on vegetation, land type, and lighting.

    LiDAR performs well in vegetated and complex situations. Its laser pulses penetrate the thick canopy and produce reliable ground models even with heavy cover. For instance, LiDAR has been found to be trustworthy where there are forest canopies of 30 meters, and it keeps its vertical accuracy within 10–15 cm as opposed to photogrammetry, which usually cannot trace the ground surface under heavy vegetation.

    Photogrammetry excels in flat, open, and well-illuminated conditions. It relies on unobstructed lines of sight and substantial lighting. In open spaces such as fields or urban areas devoid of tree cover, it produces high-resolution images and good horizontal positioning, usually 1–3 cm horizontal accuracy, although vertical accuracy deteriorates to 10–20 cm in uneven terrain or light. 

    Environmental resilience also varies:

    • Lighting and weather: LiDAR is largely unaffected by lighting conditions and can operate at night or under overcast skies. In contrast, photogrammetry requires daylight and consistent lighting to avoid shadows and glare affecting model quality.
    • Terrain complexity: Rugged terrain featuring slopes, cliffs, or mixed surfaces can unduly impact photogrammetry, which relies on visual triangulation. LiDAR’s active sensing covers complex landforms more reliably.

    “LiDAR is particularly strong in dense forest or hilly terrain, like cliffs or steep slopes”.

    Choosing Based on Terrain

    • Heavy vegetation/forests – LiDAR is the obvious choice for accurate ground modeling.
    • Flat, open land with excellent lighting – Photogrammetry is cheap and reliable.
    • Mixed terrain (e.g., farmland with woodland margins) – A hybrid strategy or LiDAR is the safer option.

    In regions like the Western Ghats or Himalayan foothills, GIS services frequently rely on LiDAR to penetrate thick forest cover and ensure accurate ground elevation data.

    Data Processing & Workflow Integration

    LiDAR creates point clouds that require heavy processing. Raw LiDAR data can be hundreds of millions of points per flight. Processing includes noise filtering out, classifying ground vs non-ground returns, and developing surface models such as DEMs and DSMs.

    This usually needs to be done using dedicated software such as LAStools or TerraScan and trained operators. High-volume projects may take weeks to days to process completely, particularly if classification is done manually. With current LiDAR processors that have AI-based classification, processing time can be minimized by up to 50% without a reduction in quality.

    Photogrammetry pipelines revolve around merging overlapping images into 3D models. Tools such as Pix4D or Agisoft Metashape automatically align hundreds of images to create dense point clouds and meshes. Automation is an attractive benefit for companies offering GIS services, allowing them to scale operations without compromising data quality.

    The processing stream is heavy, but very automated. However, image quality is a function of image resolution and overlap. A medium-sized survey might be processed within a few hours on an advanced workstation, compared to a few days with LiDAR. Yet for large sites, photogrammetry can involve more manual cleanup, particularly around shaded or homogeneous surfaces.

    • Choose LiDAR when your team can handle heavy processing demands and needs fully classified ground surfaces for advanced GIS analysis.
    • Choose photogrammetry if you value faster setup, quicker processing, and your project can tolerate some manual data cleanup or has strong GCP support.

    Hardware & Field Deployment

    Field deployment brings different demands. The right hardware ensures smooth and reliable data capture. Here’s how LiDAR and photogrammetry compare on that front.

    LiDAR Deployment

    LiDAR requires both high-capacity drones and specialized sensors. For example, the DJI Zenmuse L2, used with the Matrice 300 RTK or 350 RTK drones, weighs about 1.2 kg and delivers ±4 cm vertical accuracy, scanning up to 240k points per second and penetrating dense canopy effectively. Other sensors, like the Teledyne EchoOne, offer 1.5 cm vertical accuracy from around 120 m altitude on mid-size UAVs.

    These LiDAR-capable drones often weigh over 6 kg without payloads (e.g., Matrice 350 RTK) and can fly for 30–55 minutes, depending on payload weight.

    So, LiDAR deployment requires investment in heavier UAVs, larger batteries, and payload-ready platforms. Setup demands trained crews to calibrate IMUs, GNSS/RTK systems, and sensor mounts. Teams offering GIS consulting often help clients assess which hardware platform suits their project goals, especially when balancing drone specs with terrain complexity.

    Photogrammetry Deployment

    Photogrammetry favors lighter drones and high-resolution cameras. Systems like the DJI Matrice 300 equipped with a 45 MP Zenmuse P1 can achieve 3 cm horizontal and 5 cm vertical accuracy, and map 3 km² in one flight (~55 minutes).

    Success with camera-based systems relies on:

    • Mechanical shutters to avoid image distortion
    • Proper overlaps (80–90%) and stable flight paths 
    • Ground control points (1 per 5–10 acres) using RTK GNSS for centimeter-level geo accuracy

    Most medium-sized surveys run on 32–64 GB RAM workstations with qualified GPUs.

    Deployment Comparison at a Glance


    Aspect  LiDAR Photogrammetry 
    Drone requirements ≥6 kg payload, long battery life 3–6 kg, standard mapping drones
    Sensor setup Laser scanner, IMU/GNSS, calibration needed High-resolution camera, mechanical shutter, GCPs/RTK
    Flight time impact Payload reduces endurance ~20–30% Similar reduction; camera weight less critical
    Crew expertise required High—sensor alignment, real-time monitoring Moderate — flight planning, image quality checks
    Processing infrastructure High-end PC, parallel LiDAR tools 32–128 GB RAM, GPU-enabled for photogrammetry


    LiDAR demands stronger UAV platforms, complex sensor calibration, and heavier payloads, but delivers highly accurate ground models even under foliage.

    Photogrammetry is more accessible, using standard mapping drones and high-resolution cameras. However, it requires careful flight planning, GCP setup, and capable processing hardware.

    Cost Implications

    LiDAR requires a greater initial investment. A full LiDAR system, which comprises a laser scanner, an IMU, a GNSS, and a compatible UAV aircraft, can range from $90,000 to $350,000. Advanced models such as the DJI Zenmuse L2, combined with a Matrice 300 or 350 RTK aircraft, are common in survey-grade undertakings.

    If you’re not buying in bulk, LiDAR data collection services typically begin at about $300 an hour and go higher than $1,000 based on the type of terrain and resolution needed.

    Photogrammetry tools are considerably more affordable. An example is a $2,000 to $20,000 high-resolution drone with a mechanical shutter camera. In most business applications, photogrammetry services are charged at $150-$500 per hour, which makes it a viable alternative for repeat or cost-conscious mapping projects.

    In short, LiDAR costs more to deploy but may save time and manual effort downstream. Photogrammetry is cheaper upfront but demands more fieldwork and careful processing. Your choice depends on the long-term cost of error versus the up-front budget you’re working with.

    A well-executed GIS consulting engagement often clarifies these trade-offs early, helping stakeholders avoid costly over-investment or underperformance.

    Final Take: LiDAR vs Photogrammetry for GIS

    A decision between LiDAR and photogrammetry isn’t so much about specs. It’s about understanding which one fits with your site conditions, data requirements, and the results your project relies on.

    Both are strong suits. LiDAR provides you with improved results on uneven ground, heavy vegetation, and high-precision operations. Photogrammetry provides lean operation when you require rapid, broad sweeps in open spaces. But the true potential lies in combining them, with one complementing the other where it is needed.

    If you’re unsure which direction to take, a focused GIS consulting session with SCSTech can save weeks of rework and ensure your spatial data acquisition is aligned with project outcomes. Whether you’re working on smart city development or agricultural mapping, selecting the right remote sensing method is crucial for scalable GIS projects in India.

    We don’t just provide LiDAR or photogrammetry; our GIS services are tailored to deliver the right solution for your project’s scale and complexity.

    Consult with SCSTech to get a clear, technical answer on what fits your project, before you invest more time or budget in the wrong direction.

  • Can RPA Work With Legacy Systems? Here’s What You Need to Know!

    Can RPA Work With Legacy Systems? Here’s What You Need to Know!

    It’s a question more IT leaders are asking as automation pressures rise and modernization budgets lag behind. 

    While robotic process automation (RPA) promises speed, scale, and relief from manual drudgery, most organizations aren’t operating in cloud-native environments. They’re still tied to legacy systems built decades ago and not exactly known for playing well with new tech.

    So, can RPA actually work with these older systems? Short answer: yes, but not without caveats. This article breaks down how RPA fits into legacy infrastructure, what gets in the way, and how smart implementation can turn technical debt into a scalable automation layer.

    Let’s get into it.

    Understanding the Compatibility Between RPA and Legacy Systems

    Legacy systems aren’t built for modern integration, but that’s exactly where RPA finds its edge. Unlike traditional automation tools that depend on APIs or backend access, RPA Services works through the user interface, mimicking human interactions with software. That means even if a system is decades old, closed off, or no longer vendor-supported, RPA can still operate on it, safely and effectively.

    This compatibility isn’t a workaround — it’s a deliberate strength. For companies running mainframes, terminal applications, or custom-built software, RPA offers a non-invasive way to automate without rewriting the entire infrastructure.

    How RPA Maintains Compatibility with Legacy Systems:

    • UI-Level Interaction: RPA tools replicate keyboard strokes, mouse clicks, and field entries, just like a human operator, regardless of how old or rigid the system is.
    • No Code-Level Dependencies: Since bots don’t rely on source code or APIs, they work even when backend integration isn’t possible.
    • Terminal Emulator Support: Most RPA platforms include support for green-screen mainframes (e.g., TN3270, VT100), enabling interaction with host-based systems.
    • OCR & Screen Scraping: For systems that don’t expose readable text, bots can use optical character recognition (OCR) to extract and process data.
    • Low-Risk Deployment: Because RPA doesn’t alter the underlying system, it poses minimal risk to legacy environments and doesn’t interfere with compliance.

    Common Challenges When Connecting RPA to Legacy Environments

    While RPA is compatible with most legacy systems on the surface, getting it to perform consistently at scale isn’t always straightforward. Legacy environments come with quirks — from unpredictable interfaces to tight access restrictions — that can compromise bot reliability and performance if not accounted for early.

    Some of the most common challenges include:

    1. Unstable or Inconsistent Interfaces

    Legacy systems often lack UI standards. A small visual change — like a shifted field or updated window — can break bot workflows. Since RPA depends on pixel- or coordinate-level recognition in these cases, any visual inconsistency can cause the automation to fail silently.

    2. Limited Access or Documentation

    Many legacy platforms have little-to-no technical documentation. Access might be locked behind outdated security protocols or hardcoded user roles. This makes initial configuration and bot design harder, especially when developers need to reverse-engineer interface logic without support from the original vendor.

    3. Latency and Response Time Issues

    Older systems may not respond at consistent speeds. RPA bots, which operate on defined wait times or expected response behavior, can get tripped up by delays, resulting in skipped steps, premature entries, or incorrect reads.

    Advanced RPA platforms allow dynamic wait conditions (e.g., “wait until this field appears”) rather than fixed timers.

    4. Citrix or Remote Desktop Environments

    Some legacy apps are hosted on Citrix or RDP setups where bots don’t “see” elements the same way they would on local machines. This forces developers to rely on image recognition or OCR, which are more fragile and require constant calibration.

    5. Security and Compliance Constraints

    Many legacy systems are tied into regulated environments — banking, utilities, government — where change control is strict. Even though RPA is non-invasive, introducing bots may still require IT governance reviews, user credential rules, and audit trails to pass compliance.

    Best Practices for Implementing RPA with Legacy Systems

    Best Practices for Successful RPA in Legacy Systems

    Implementing RPA Development Services in a legacy environment is not plug-and-play. While modern RPA platforms are built to adapt, success still depends on how well you prepare the environment, design the workflows, and choose the right processes.

    Here are the most critical best practices:

    1. Start with High-Volume, Rule-Based Tasks

    Legacy systems often run mission-critical functions. Instead of starting with core processes, begin with non-invasive, rule-driven workflows like:

    • Data extraction from mainframe screens
    • Invoice entry or reconciliation
    • Batch report generation

    These use cases deliver ROI fast and avoid touching business logic, minimizing risk. 

    2. Use Object-Based Automation Where Possible

    When dealing with older apps, UI selectors (object-based interactions) are more stable than image recognition. But not all legacy systems expose selectors. Identify which parts of the system support object detection and prioritize automations there.

    Tools like UiPath and Blue Prism offer hybrid modes (object + image) — use them strategically to improve reliability.

    3. Build In Exception Handling and Logging from Day One

    Legacy systems can behave unpredictably — failed logins, unexpected pop-ups, or slow responses are common. RPA bots should be designed with:

    • Try/catch blocks for known failures
    • Timeouts and retries for latency
    • Detailed logging for root-cause analysis

    Without this, bot failures may go undetected, leading to invisible operational errors — a major risk in high-compliance environments.

    4. Mirror the Human Workflow First — Then Optimize

    Start by replicating how a human would perform the task in the legacy system. This ensures functional parity and easier stakeholder validation. Once stable, optimize:

    • Reduce screen-switches
    • Automate parallel steps
    • Add validations that the system lacks

    This phased approach avoids early overengineering and builds trust in automation.

    5. Test in Production-Like Environments

    Testing legacy automation in a sandbox that doesn’t behave like production is a common failure point. Use a cloned environment with real data or test after hours in production with read-only roles, if available.

    Legacy UIs often behave differently depending on screen resolution, load, or session type — catch this early before scaling.

    6. Secure Credentials with Vaults or IAM

    Hardcoding credentials for bots in legacy systems is a major compliance red flag. Use:

    • RPA-native credential vaults (e.g., CyberArk integrations)
    • Role-based access controls
    • Scheduled re-authentication policies

    This reduces security risk while keeping audit logs clean for governance teams.

    7. Loop in IT, Not Just Business Teams

    Legacy systems are often undocumented or supported by a single internal team. Avoid shadow automation. Work with IT early to:

    • Map workflows accurately
    • Get access permissions
    • Understand system limitations

    Collaboration here prevents automation from becoming brittle or blocked post-deployment.

    RPA in legacy environments is less about brute-force automation and more about thoughtful design under constraint. Build with the assumption that things will break — and then build workflows that recover fast, log clearly, and scale without manual patchwork.

    Is RPA a Long-Term Solution for Legacy Systems?

    Yes, but only when used strategically. 

    RPA isn’t a forever fix for legacy systems, but it is a durable bridge, one that buys time, improves efficiency, and reduces operational friction while companies modernize at their own pace.

    For utility, finance, and logistics firms still dependent on legacy environments, RPA offers years of viable value when:

    • Deployed with resilience and security in mind
    • Designed around the system’s constraints, not against them
    • Scaled through a clear governance model

    However, RPA won’t modernize the core, it enhances what already exists. For long-term ROI, companies must pair automation with a roadmap that includes modernization or system transformation in parallel.

    This is where SCSTech steps in. We don’t treat robotic process automation as a tool; we approach it as a tactical asset inside larger modernization strategy. Whether you’re working with green-screen terminals, aging ERP modules, or disconnected data silos, our team helps you implement automation that’s reliable now, but aligned with where your infrastructure needs to go.

  • The ROI of Sensor-Driven Asset Health Monitoring in Midstream Operations

    The ROI of Sensor-Driven Asset Health Monitoring in Midstream Operations

    In midstream, a single asset failure can halt operations and burn through hundreds of thousands in downtime and emergency response.

    Yet many operators still rely on time-based checks and manual inspections — methods that often catch problems too late, or not at all.

    Sensor-driven asset health monitoring flips the model. With real-time data from embedded sensors, teams can detect early signs of wear, trigger predictive maintenance, and avoid costly surprises. 

    This article unpacks how that visibility translates into real, measurable ROI. This article unpacks how that visibility translates into real, measurable ROI, especially when paired with oil and gas technology solutions designed to perform in high-risk, midstream environments.

    What Is Sensor-Driven Asset Health Monitoring in Midstream?

    In midstream operations — pipelines, storage terminals, compressor stations — asset reliability is everything. A single pressure drop, an undetected leak, or delayed maintenance can create ripple effects across the supply chain. That’s why more midstream operators are turning to sensor-driven asset health monitoring.

    At its core, this approach uses a network of IoT-enabled sensors embedded across critical assets to track their condition in real time. It’s not just about reactive alarms. These sensors continuously feed data on:

    • Pressure and flow rates
    • Temperature fluctuations
    • Vibration and acoustic signals
    • Corrosion levels and pipeline integrity
    • Valve performance and pump health

    What makes this sensor-driven model distinct is the continuous diagnostics layer it enables. Instead of relying on fixed inspection schedules or manual checks, operators gain a live feed of asset health, supported by analytics and thresholds that signal risk before failure occurs.

    In midstream, where the scale is vast and downtime is expensive, this shift from interval-based monitoring to real-time condition-based oversight isn’t just a tech upgrade — it’s a performance strategy.

    Sensor data becomes the foundation for:

    • Predictive maintenance triggers
    • Remote diagnostics
    • Failure pattern analysis
    • And most importantly, operational decisions grounded in actual equipment behavior

    The result? Fewer surprises, better safety margins, and a stronger position to quantify asset reliability — something we’ll dig into when talking ROI.

    Key Challenges in Midstream Asset Management Without Sensors

    Risk Without Sensor-Driven Monitoring

    Without sensor-driven monitoring, midstream operators are often flying blind across large, distributed, high-risk systems. Traditional asset management approaches — grounded in manual inspections, periodic maintenance, and lagging indicators — come with structural limitations that directly impact reliability, cost control, and safety.

    Here’s a breakdown of the core challenges:

    1. Delayed Fault Detection

    Without embedded sensors, operators depend on scheduled checks or human observation to identify problems.

    • Leaks, pressure drops, or abnormal vibrations can go unnoticed for hours — sometimes days — between inspections.
    • Many issues only become visible after performance degrades or equipment fails, resulting in emergency shutdowns or unplanned outages.

    2. Inability to Track Degradation Trends Over Time

    Manual inspections are episodic. They provide snapshots, not timelines.

    • A technician may detect corrosion or reduced valve responsiveness during a routine check, but there’s no continuity to know how fast the degradation is occurring or how long it’s been developing.
    • This makes it nearly impossible to predict failures or plan proactive interventions.

    3. High Cost of Unplanned Downtime

    In midstream, pipeline throughput, compression, and storage flow must stay uninterrupted.

    • An unexpected pump failure or pipe leak doesn’t just stall one site — it disrupts the supply chain across upstream and downstream operations.
    • Emergency repairs are significantly more expensive than scheduled interventions and often require rerouting or temporary shutdowns.

    A single failure event can cost hundreds of thousands in downtime, not including environmental penalties or lost product.

    4. Limited Visibility Across Remote or Hard-to-Access Assets

    Midstream infrastructure often spans hundreds of miles, with many assets located underground, underwater, or in remote terrain.

    • Manual inspections of these sites are time-intensive and subject to environmental and logistical delays.
    • Data from these assets is often sparse or outdated by the time it’s collected and reported.

    Critical assets remain unmonitored between site visits — a major vulnerability for high-risk assets.

    5. Regulatory and Reporting Gaps

    Environmental and safety regulations demand consistent documentation of asset integrity, especially around leaks, emissions, and spill risks.

    • Without sensor data, reporting is dependent on human records, often inconsistent and subject to audits.
    • Missed anomalies or delayed documentation can result in non-compliance fines or reputational damage.

    Lack of real-time data makes regulatory defensibility weak, especially during incident investigations.

    6. Labor Dependency and Expertise Gaps

    A manual-first model heavily relies on experienced field technicians to detect subtle signs of wear or failure.

    • As experienced personnel retire and talent pipelines shrink, this approach becomes unsustainable.
    • Newer technicians lack historical insight, and without sensors, there’s no system to bridge the knowledge gap.

    Reliability becomes person-dependent instead of system-dependent.

    Without system-level visibility, operators lack the actionable insights provided by modern oil and gas technology solutions, which creates a reactive, risk-heavy environment.

    This is exactly where sensor-driven monitoring begins to shift the balance, from exposure to control.

    Calculating ROI from Sensor-Driven Monitoring Systems

    For midstream operators, investing in sensor-driven asset health monitoring isn’t just a tech upgrade — it’s a measurable business case. The return on investment (ROI) stems from one core advantage: catching failures before they cascade into costs.

    Here’s how the ROI typically stacks up, based on real operational variables:

    1. Reduced Unplanned Downtime

    Let’s start with the cost of a midstream asset failure.

    • A compressor station failure can cost anywhere from $50,000 to $300,000 per day in lost throughput and emergency response.
    • With real-time vibration or pressure anomaly detection, sensor systems can flag degradation days before failure, enabling scheduled maintenance.

    If even one major outage is prevented per year, the sensor system often pays for itself multiple times over.

    2. Optimized Maintenance Scheduling

    Traditional maintenance is either time-based (replace parts every X months) or fail-based (fix it when it breaks). Both are inefficient.

    • Sensors enable condition-based maintenance (CBM) — replacing components when wear indicators show real need.
    • This avoids early replacement of healthy equipment and extends asset life.

    Lower maintenance labor hours, fewer replacement parts, and less downtime during maintenance windows.

    3. Fewer Compliance Violations and Penalties

    Sensor-driven monitoring improves documentation and reporting accuracy.

    • Leak detection systems, for example, can log time-stamped emissions data, critical for EPA and PHMSA audits.
    • Real-time alerts also reduce the window for unnoticed environmental releases.

    Avoidance of fines (which can exceed $100,000 per incident) and a stronger compliance posture during inspections.

    4. Lower Insurance and Risk Exposure

    Demonstrating that assets are continuously monitored and failures are mitigated proactively can:

    • Reduce risk premiums for asset insurance and liability coverage
    • Strengthen underwriting positions in facility risk models

    Lower annual risk-related costs and better positioning with insurers.

    5. Scalability Without Proportional Headcount

    Sensors and dashboards allow one centralized team to monitor hundreds of assets across vast geographies.

    • This reduces the need for site visits, on-foot inspections, and local diagnostic teams.
    • It also makes asset management scalable without linear increases in staffing costs.

    Bringing it together:

    Most midstream operators using sensor-based systems calculate ROI in 3–5 operational categories. Here’s a simplified example:

    ROI Area Annual Savings Estimate
    Prevented Downtime (1 event) $200,000
    Optimized Maintenance $70,000
    Compliance Penalty Avoidance $50,000
    Reduced Field Labor $30,000
    Total Annual Value $350,000
    System Cost (Year 1) $120,000
    First-Year ROI ~192%


    Over 3–5 years, ROI improves as systems become part of broader operational workflows, especially when data integration feeds into predictive analytics and enterprise decision-making.

    ROI isn’t hypothetical anymore. With real-time condition data, the economic case for sensor-driven monitoring becomes quantifiable, defensible, and scalable.

    Conclusion

    Sensor-driven monitoring isn’t just a nice-to-have — it’s a proven way for midstream operators to cut downtime, reduce maintenance waste, and stay ahead of failures. With the right data in hand, teams stop reacting and start optimizing.

    SCSTech helps you get there. Our digital oil and gas technology solutions are built for real-world midstream conditions — remote assets, high-pressure systems, and zero-margin-for-error operations.

    If you’re ready to make reliability measurable, SCSTech delivers the technical foundation to do it.

  • Using GIS Mapping to Identify High-Risk Zones for Earthquake Preparedness

    Using GIS Mapping to Identify High-Risk Zones for Earthquake Preparedness

    GIS mapping combines seismicity, ground conditions, building exposure, and evacuation routes into multi-layer, spatial models. This gives a clear, specific image of where the greatest dangers are — a critical function in disaster response software designed for earthquake preparedness.

    Using this information, planners and emergency responders can target resources, enhance infrastructure strength, and create effective evacuation plans individualized for the zones that require it most.

    In this article, we dissect how GIS maps pinpoint high-risk earthquake areas and why this spatial accuracy is critical to constructing wiser, life-saving readiness plans.

    Why GIS Mapping Matters for Earthquake Preparedness?

    When it comes to earthquake resilience, geography isn’t just a consideration — it’s the whole basis of risk. The key to minimal disruption versus disaster is where the infrastructure is located, how the land responds when stressed, and what populations are in the path.

    That’s where GIS mapping steps in — not as a passive data tool, but as a central decision engine for risk identification and GIS and disaster management planning.

    Here’s why GIS is indispensable:

    • Earthquake risk is spatially uneven. Some zones rest directly above active fault lines, others lie on liquefiable soil, and many are in structurally vulnerable urban cores. GIS doesn’t generalize — it pinpoints. It visualizes how these spatial variables overlap and create compounded risks.
    • Preparedness needs layered visibility. Risk isn’t just about tectonics. It’s about how seismic energy interacts with local geology, critical infrastructure, and human activity. GIS allows planners to stack these variables — seismic zones, building footprints, population density, utility lines — to get a granular, real-time understanding of risk concentration.
    • Speed of action depends on the clarity of data. During a crisis, knowing which areas will be hit hardest, which routes are most likely to collapse, and which neighborhoods lack structural resilience is non-negotiable. GIS systems provide this insight before the event, enabling governments and agencies to act, not react.

    GIS isn’t just about making maps look smarter. It’s about building location-aware strategies that can protect lives, infrastructure, and recovery timelines.

    Without GIS, preparedness is built on assumptions. With it, it’s built on precision.

    How GIS Identifies High-Risk Earthquake Zones

    How GIS Maps Earthquake Risk Zones with Layered Precision

    Not all areas within an earthquake-prone region carry the same level of risk. Some neighborhoods are built on solid bedrock. Others sit on unstable alluvium or reclaimed land that could amplify ground shaking or liquefy under stress. What differentiates a moderate event from a mass-casualty disaster often lies in these invisible geographic details.

    Here’s how it works in operational terms:

    1. Layering Historical Seismic and Fault Line Data

    GIS platforms integrate high-resolution datasets from geological agencies (like USGS or national seismic networks) to visualize:

    • The proximity of assets to fault lines
    • Historical earthquake occurrences — including magnitude, frequency, and depth
    • Seismic zoning maps based on recorded ground motion patterns

    This helps planners understand not just where quakes happen, but where energy release is concentrated and where recurrence is likely.

    2. Analyzing Geology and Soil Vulnerability

    Soil type plays a defining role in earthquake impact. GIS systems pull in geoengineering layers that include:

    • Soil liquefaction susceptibility
    • Slope instability and landslide zones
    • Water table depth and moisture retention capacity

    By combining this with surface elevation models, GIS reveals which areas are prone to ground failure, wave amplification, or surface rupture — even if those zones are outside the epicenter region.

    3. Overlaying Built Environment and Population Exposure

    High-risk zones aren’t just geological — they’re human. GIS integrates urban planning data such as:

    • Building density and structural typology (e.g., unreinforced masonry, high-rise concrete)
    • Age of construction and seismic retrofitting status
    • Population density during day/night cycles
    • Proximity to lifelines like hospitals, power substations, and water pipelines

    These layers turn raw hazard maps into impact forecasts, pinpointing which blocks, neighborhoods, or industrial zones are most vulnerable — and why.

    4. Modeling Accessibility and Emergency Constraints

    Preparedness isn’t just about who’s at risk — it’s also about how fast they can be reached. GIS models simulate:

    • Evacuation route viability based on terrain and road networks
    • Distance from emergency response centers
    • Infrastructure interdependencies — e.g., if one bridge collapses, what neighborhoods become unreachable?

    GIS doesn’t just highlight where an earthquake might hit — it shows where it will hurt the most, why it will happen there, and what stands to be lost. That’s the difference between reacting with limited insight and planning with high precision.

    Key GIS Data Inputs That Influence Risk Mapping

    Accurate identification of earthquake risk zones depends on the quality, variety, and granularity of the data fed into a GIS platform. Different datasets capture unique risk factors, and when combined, they paint a comprehensive picture of hazard and vulnerability.

    Let’s break down the essential GIS inputs that drive earthquake risk mapping:

    1. Seismic Hazard Data

    This includes:

    • Fault line maps with exact coordinates and fault rupture lengths
    • Historical earthquake catalogs detailing magnitude (M), depth (km), and frequency
    • Peak Ground Acceleration (PGA) values: A critical metric used to estimate expected shaking intensity, usually expressed as a fraction of gravitational acceleration (g). For example, a PGA of 0.4g indicates ground shaking with 40% of Earth’s gravity force — enough to cause severe structural damage.

    GIS integrates these datasets to create probabilistic seismic hazard maps. These maps often express risk in terms of expected ground shaking exceedance within a given return period (e.g., 10% probability of exceedance in 50 years).

    2. Soil and Geotechnical Data

    Soil composition and properties modulate seismic wave behavior:

    • Soil type classification (e.g., rock, stiff soil, soft soil) impacts the amplification of seismic waves. Soft soils can increase shaking intensity by up to 2-3 times compared to bedrock.
    • Liquefaction susceptibility indexes quantify the likelihood that saturated soils will temporarily lose strength, turning solid ground into a fluid-like state. This risk is highest in loose sandy soils with shallow water tables.
    • Slope and landslide risk models identify areas where shaking may trigger secondary hazards such as landslides, compounding damage.

    GIS uses Digital Elevation Models (DEM) and borehole data to spatially represent these factors. Combining these with seismic data highlights zones where ground failure risks can triple expected damage.

    3. Built Environment and Infrastructure Datasets

    Structural vulnerability is central to risk:

    • Building footprint databases detail the location, size, and construction material of each structure. For example, unreinforced masonry buildings have failure rates up to 70% at moderate shaking intensities (PGA 0.3-0.5g).
    • Critical infrastructure mapping covers hospitals, fire stations, water treatment plants, power substations, and transportation hubs. Disruption in these can multiply casualties and prolong recovery.
    • Population density layers often leverage census data and real-time mobile location data to model daytime and nighttime occupancy variations. Urban centers may see population densities exceeding 10,000 people per square kilometer, vastly increasing exposure.

    These datasets feed into risk exposure models, allowing GIS to calculate probable damage, casualties, and infrastructure downtime.

    4. Emergency Access and Evacuation Routes

    GIS models simulate accessibility and evacuation scenarios by analyzing:

    • Road network connectivity and capacity
    • Bridges and tunnels’ structural health and vulnerability
    • Alternative routing options in case of blocked pathways

    By integrating these diverse datasets, GIS creates a multi-dimensional risk profile that doesn’t just map hazard zones, but quantifies expected impact with numerical precision. This drives data-backed preparedness rather than guesswork.

    Conclusion 

    By integrating seismic hazard patterns, soil conditions, urban vulnerability, and emergency logistics, GIS equips utility firms, government agencies, and planners with the tools to anticipate failures before they happen and act decisively to protect communities, exactly the purpose of advanced methods to predict natural disasters and robust disaster response software.

    For organizations committed to leveraging cutting-edge technology to enhance disaster resilience, SCSTech offers tailored GIS solutions that integrate complex data layers into clear, operational risk maps. Our expertise ensures your earthquake preparedness plans are powered by precision, making smart, data-driven decisions the foundation of your risk management strategy.

  • Logistics Firms Are Slashing Fuel Costs with AI Route Optimization—Here’s How

    Logistics Firms Are Slashing Fuel Costs with AI Route Optimization—Here’s How

    Route optimization that are based on static data and human choice tend to fall short of possibilities to save money, resulting in inefficiencies and wasted fuel use.

    Artificial intelligence route optimization fills the gap by taking advantage of real-time data, predictive algorithms, and machine learning that dynamically alter routes in response to current conditions, including changes in traffic and weather. Using this technology, logistics companies can not only improve delivery time but also save huge amounts of fuel—lessening costs as well as environmental costs.

    In this article, we’ll dive into how AI-powered route optimization is transforming logistics operations, offering both short-term savings and long-term strategic advantages.

    What’s Really Driving the Fuel Problem in Logistics Today?

    Per gallon of gasoline costs $3.15. But that’s not the problem logistics are dealing with. The problem is the inefficiency at multiple points in the delivery process. 

    Here’s a breakdown of the key contributors to the fuel problem:

    • Traffic and Congestion: Delivery trucks idle almost 30% of the time in traffic conditions in urban regions. Static route plans do not take into consideration real-time traffic congestion, which results in excess fuel consumption and late delivery.
    • Idling and Delays: Cumulative waiting times at the delivery points or loading/unloading stations. Idling raises the fuel consumption level and lowers productivity overall.
    • Inefficient Rerouting: Drivers often have to rely on outdated route plans, which fail to adapt to sudden changes like road closures, accidents, or detours, leading to inefficient rerouting and excess fuel use.
    • Poor Driver Habits: Poor driving habits—like speeding, harsh braking, or rapid acceleration—can reduce fuel efficiency by as much as 30% on highways and 10 – 40% in city driving.
    • Static Route Plans: Classical planning tends to presume that the first route is the optimal route, without considering actual-time environmental changes.

    While traditional route planning focuses solely on distance, the modern logistics challenge is far more complex.

    The problem isn’t just about distance—it’s about the time between decision-making moments. Decision latency—the gap between receiving new information (like traffic updates) and making a change—can have a profound impact on fuel usage. With every second lost, logistics firms burn more fuel.

    Traditional methods simply can’t adapt quickly enough to reduce fuel waste, but with the addition of AI, decisions can be automated in real-time, and routes can be adjusted dynamically to optimize the fuel efficiency.

    The Benefits of AI Route Optimization for Logistic Companies

    AI Route Optimization for Logistics Companies

    1. Reducing Wasted Miles and Excessive Idling

    Fuel consumption is heavily influenced by wasted time. 

    Unlike traditional systems that rely on static waypoints or historical averages, AI models are fed with live inputs from GPS signals, driver telemetry, municipal traffic feeds, and even weather APIs. These models use predictive analytics to detect emerging traffic patterns before they become bottlenecks and reroute deliveries proactively—sometimes before a driver even encounters a slowdown.

    What does this mean for logistics firms?

    • Fuel isn’t wasted reacting to problems—it’s saved by anticipating them.
    • Delivery ETAs stay accurate, which protects SLAs and reduces penalty risks.
    • Idle time is minimized, not just in traffic but at loading docks, thanks to integrations with warehouse management systems that adjust arrival times dynamically.

    The AI chooses the smartest options, prioritizing consistent movement, minimal stops, and smooth terrain. Over hundreds of deliveries per day, these micro-decisions lead to measurable gains: reduced fuel bills, better driver satisfaction, and more predictable operational costs.

    This is how logistics firms are moving from reactive delivery models to intelligent, pre-emptive routing systems—driven by real-time data, and optimized for efficiency from the first mile to the last.

    1. Smarter, Real-Time Adaptability to Traffic Conditions

    AI doesn’t just plan for the “best” route at the start of the day—it adapts in real time. 

    Using a combination of live traffic feeds, vehicle sensor data, and external data sources like weather APIs and accident reports, AI models update delivery routes in real time. But more than that, they prioritize fuel efficiency metrics—evaluating elevation shifts, average stop durations, road gradient, and even left-turn frequency to find the path that burns the least fuel, not just the one that arrives the fastest. This level of contextual optimization is only possible with a robust AI/ML service that can continuously learn and adapt from traffic data and driving conditions.

    The result?

    • Route changes aren’t guesswork—they’re cost-driven.
    • On long-haul routes, fuel burn can be reduced by up to 15% simply by avoiding high-altitude detours or stop-start urban traffic.
    • Over time, the system becomes smarter per region—learning traffic rhythms specific to cities, seasons, and even lanes.

    This level of adaptability is what separates rule-based systems from machine learning models: it’s not just a reroute, it’s a fuel-aware, performance-optimized redirect—one that scales with every mile logged.

    1. Load Optimization for Fuel Efficiency

    Whether a truck is carrying a full load or a partial one, AI adjusts its recommendations to ensure the vehicle isn’t overworking itself, driving fuel consumption up unnecessarily. 

    For instance, AI accounts for vehicle weight, cargo volume, and even the terrain—knowing that a fully loaded truck climbing steep hills will consume more fuel than one carrying a lighter load on flat roads. 

    This leads to more tailored, precise decisions that optimize fuel usage based on load conditions, further reducing costs.

    What Does AI Route Optimization Actually Work?

    AI route optimization is transforming logistics by addressing the inefficiencies that traditional routing methods can’t handle. It moves beyond static plans, offering a dynamic, data-driven approach to reduce fuel consumption and improve overall operational efficiency. Here’s a clear breakdown of how AI does this:

    Predictive vs. Reactive Routing

    Traditional systems are reactive by design: they wait for traffic congestion to appear before recalculating. By then, the vehicle is already delayed, the fuel is already burned, and the opportunity to optimize is gone.

    AI flips this entirely.

    It combines:

    • Historical traffic patterns (think: congestion trends by time-of-day or day-of-week),
    • Live sensor inputs from telematics systems (speed, engine RPM, idle time),
    • External data streams (weather services, construction alerts, accident reports),
    • and driver behavior models (based on past performance and route habits)

    …to generate routes that aren’t just “smart”—they’re anticipatory.

    For example, if a system predicts a 60% chance of a traffic jam on Route A due to a football game starting at 5 PM, and the delivery is scheduled for 4:45 PM, it will reroute the vehicle through a slightly longer but consistently faster highway path—preventing idle time before it starts.

    This kind of proactive rerouting isn’t based on a single event; it’s shaped by millions of data points and fine-tuned by machine learning models that improve with each trip logged. With every dataset processed, an AI/ML service gains more predictive power, enabling it to make even more fuel-efficient decisions in future deliveries. Over time, this allows logistics firms to build an operational strategy around predictable fuel savings, not just reactive cost-cutting.

    Real-Time Data Inputs (Traffic, Weather, Load Data)

    AI systems integrate:

    • Traffic flow data from GPS providers, municipal feeds, and crowdsourced platforms like Waze.
    • Weather intelligence APIs to account for storm patterns, wind resistance, and road friction risks.
    • Vehicle telematics for current load weight, which affects acceleration patterns and optimal speeds.

    Each of these feeds becomes part of a dynamic route scoring model. For example, if a vehicle carrying a heavy load is routed into a hilly region during rainfall, fuel consumption may spike due to increased drag and braking. A well-tuned AI system reroutes that load along a flatter, dryer corridor—even if it’s slightly longer in distance—because fuel efficiency, not just mileage, becomes the optimized metric.

    This data fusion also happens at high frequency—every 5 to 15 seconds in advanced systems. That means as soon as a new traffic bottleneck is detected or a sudden road closure occurs, the algorithm recalculates, reducing decision latency to near-zero and preserving route efficiency with no human intervention.

    Vehicle-Specific Considerations

    Heavy-duty trucks carrying full loads can consume up to 50% more fuel per mile than lighter or empty ones, according to the U.S. Department of Energy. That means sending two different trucks down the same “optimal” route—without factoring in grade, stop frequency, or road surface—can result in major fuel waste.

    AI takes this into account in real time, adjusting:

    • Route incline based on gross vehicle weight and torque efficiency
    • Stop frequency based on vehicle type (e.g., hybrid vs. diesel)
    • Fuel burn curves that shift depending on terrain and traffic

    This level of precision allows fleet managers to assign the right vehicle to the right route—not just any available truck. And when combined with historical performance data, the AI can even learn which vehicles perform best on which corridors, continually improving the match between route and machine.

    Automatic Rerouting Based on Traffic/Data Drift

    AI’s real-time adaptability means that as traffic conditions change, or if new data becomes available (e.g., a road closure), the system automatically reroutes the vehicle to a more efficient path. 

    For example, if a major accident suddenly clogs a key highway, the AI can detect it within seconds and reroute the vehicle through a less congested arterial road—without the driver needing to stop or call dispatch. 

    Machine Learning: Continuous Improvement Over Time

    The most powerful aspect of AI is its machine learning capability. Over time, the system learns from outcomes—whether a route led to a fuel-efficient journey or created unnecessary delays. 

    With this knowledge, it continuously refines its algorithms, becoming better at predicting the most efficient routes and adapting to new challenges. AI doesn’t just optimize based on past data; it evolves and gets smarter with every trip.

    Bottom Line

    AI route optimization is not just a technological upgrade—it’s a strategic investment. 

    Firms that adopt AI-powered planning typically cut fuel expenses by 7–15%, depending on fleet size and operational complexity. But the value doesn’t stop there. Reduced idling, smarter rerouting, and fewer detours also mean less wear on vehicles, better delivery timing, and higher driver output.

    If you’re ready to make your fleet leaner, faster, and more fuel-efficient, SCS Tech’s AI logistics suite is built to deliver exactly that. Whether you need plug-and-play solutions or a fully customised AI/ML service, integrating these technologies into your logistics workflow is the key to sustained cost savings and competitive advantage. Contact us today to learn how we can help you drive smarter logistics and significant cost savings.