Category: predictive analysis

  • How AgTech Startups Use GIS to Optimize Irrigation and Crop Planning

    How AgTech Startups Use GIS to Optimize Irrigation and Crop Planning

    Farming isn’t uniform. In the evolving landscape of agriculture & technology, soil properties, moisture levels, and crop needs can change dramatically within meters — yet many irrigation strategies still treat fields as a single, homogenous unit.

    GIS (Geographic Information Systems) offers precise, location-based insights by layering data on soil texture, elevation, moisture, and crop growth stages. This spatial intelligence lets AgTech startups move beyond blanket irrigation to targeted water management.

    By integrating GIS with sensor data and weather models, startups can tailor irrigation schedules and volumes to the specific needs of micro-zones within a field. This approach reduces inefficiencies, helps conserve water, and supports consistent crop performance.

    Importance of GIS in Agriculture for Irrigation and Crop Planning

    Agriculture isn’t just about managing land. It’s about managing variation. Soil properties shift within a few meters. Rainfall patterns change across seasons. Crop requirements differ from one field to the next. Making decisions based on averages or intuition leads to wasted water, underperforming yields, and avoidable losses.

    GIS (Geographic Information Systems) is how AgTech startups leverage agriculture & technology innovations to turn this variability into a strategic advantage.

    GIS gives a spatial lens to data that was once trapped in spreadsheets or siloed systems. With it, agri-tech innovators can:

    • Map field-level differences in soil moisture, slope, texture, and organic content — not as general trends but as precise, geo-tagged layers.
    • Align irrigation strategies with crop needs, landform behavior, and localized weather forecasts.
    • Support real-time decision-making, where planting windows, water inputs, and fertilizer applications are all tailored to micro-zone conditions.

    To put it simply: GIS enables location-aware farming. And in irrigation or crop planning, location is everything.

    A one-size-fits-all approach may lead to 20–40% water overuse in certain regions and simultaneous under-irrigation in others. By contrast, GIS-backed systems can reduce water waste by up to 30% while improving crop yield consistency, especially in water-scarce zones.

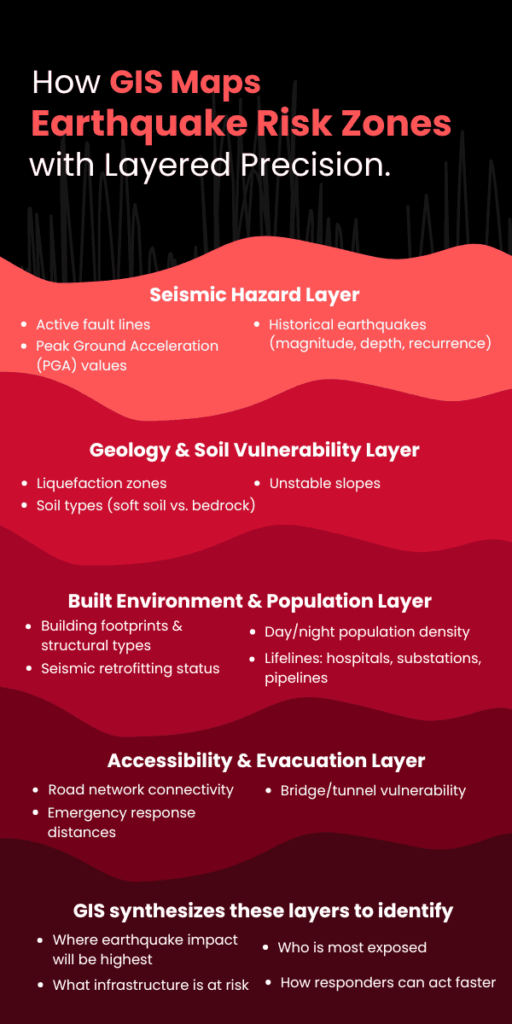
    GIS Data Layers Used for Irrigation and Crop Decision-Making

    GIS Data Layers Powering Smarter Irrigation and Crop Planning

    The power of GIS lies in its ability to stack different data layers — each representing a unique aspect of the land — into a single, interpretable visual model. For AgTech startups focused on irrigation and crop planning, these layers are the building blocks of smarter, site-specific decisions.

    Let’s break down the most critical GIS layers used in precision agriculture:

    1. Soil Type and Texture Maps

    • Determines water retention, percolation rate, and root-zone depth
    • Clay-rich soils retain water longer, while sandy soils drain quickly
    • GIS helps segment fields into soil zones so that irrigation scheduling aligns with water-holding capacity

    Irrigation plans that ignore soil texture can lead to overwatering on heavy soils and water stress on sandy patches — both of which hurt yield and resource efficiency.

    2. Slope and Elevation Models (DEM – Digital Elevation Models)

    • Identifies water flow direction, runoff risk, and erosion-prone zones
    • Helps calculate irrigation pressure zones and place contour-based systems effectively
    • Allows startups to design variable-rate irrigation plans, minimizing water pooling or wastage in low-lying areas

    3. Soil Moisture and Temperature Data (Often IoT Sensor-Integrated)

    • Real-time or periodic mapping of subsurface moisture levels powered by artificial intelligence in agriculture
    • GIS integrates this with surface temperature maps to detect drought stress or optimal planting windows

    Combining moisture maps with evapotranspiration models allows startups to trigger irrigation only when thresholds are crossed, avoiding fixed schedules.

    4. Crop Type and Growth Stage Maps

    • Uses satellite imagery or drone-captured NDVI (Normalized Difference Vegetation Index)
    • Tracks vegetation health, chlorophyll levels, and biomass variability across zones
    • Helps match irrigation volume to crop growth phase — seedlings vs. fruiting stages have vastly different needs

    Ensures water is applied where it’s needed most, reducing waste and improving uniformity.

    5. Historical Yield and Input Application Maps

    • Maps previous harvest outcomes, fertilizer applications, and pest outbreaks
    • Allows startups to overlay these with current-year conditions to forecast input ROI

    GIS can recommend crop shifts or irrigation changes based on proven success/failure patterns across zones.

    By combining these data layers, GIS creates a 360° field intelligence system — one that doesn’t just react to soil or weather, but anticipates needs based on real-world variability.

    How GIS Helps Optimize Irrigation in Farmlands

    Optimizing irrigation isn’t about simply adding more sensors or automating pumps. It’s about understanding where, when, and how much water each zone of a farm truly needs — and GIS is the system that makes that intelligence operational.

    Here’s how AgTech startups are using GIS to drive precision irrigation in real, measurable steps:

    1. Zoning Farmlands Based on Hydrological Behavior

    Using GIS, farmlands are divided into irrigation management zones by analyzing soil texture, slope, and historical moisture retention.

    • High clay zones may need less frequent, deeper irrigation
    • Sandy zones may require shorter, more frequent cycles
    • GIS maps these zones down to a 10m x 10m (or even finer) resolution, enabling differentiated irrigation logic per zone

    Irrigation plans stop being uniform. Instead, water delivery matches the absorption and retention profile of each micro-zone.

    2. Integrating Real-Time Weather and Evapotranspiration Data

    GIS platforms integrate satellite weather feeds and localized evapotranspiration (ET) models — which calculate how much water a crop is losing daily due to heat and wind.

    • The system then compares ET rates with real-time soil moisture data
    • When depletion crosses a set threshold (say, 50% of field capacity), GIS triggers or recommends irrigation — tailored by zone

    3. Automating Variable Rate Irrigation (VRI) Execution

    AgTech startups link GIS outputs directly with VRI-enabled irrigation systems (e.g., pivot systems or drip controllers).

    • Each zone receives a customized flow rate and timing
    • GIS controls or informs nozzles and emitters to adjust water volume on the move
    • Even during a single irrigation pass, systems adjust based on mapped need levels

    4. Detecting and Correcting Irrigation Inefficiencies

    GIS helps track where irrigation is underperforming due to:

    • Blocked emitters or leaks
    • Pressure inconsistencies
    • Poor infiltration zones

    By overlaying actual soil moisture maps with intended irrigation plans, GIS identifies deviations — sometimes in near real-time.

    Alerts are sent to field teams or automated systems to adjust flow rates, fix hardware, or reconfigure irrigation maps.

    5. Enabling Predictive Irrigation Based on Crop Stage and Forecasts

    GIS tools layer crop phenology models (growth stage timelines) with weather forecasts.

    • For example, during flowering stages, water demand may spike 30–50% for many crops.
    • GIS platforms model upcoming rainfall and temperature shifts, helping plan just-in-time irrigation events before stress sets in.

    Instead of reactive watering, farmers move into data-backed anticipation — a fundamental shift in irrigation management.

    GIS transforms irrigation from a fixed routine into a dynamic, responsive system — one that reacts to both the land’s condition and what’s coming next. AgTech startups that embed GIS into their irrigation stack aren’t just conserving water; they’re building systems that scale intelligently with environmental complexity.

    Conclusion

    GIS is no longer optional in modern agriculture & technology — it’s how AgTech startups bring precision to irrigation and crop planning. From mapping soil zones to triggering irrigation based on real-time weather and crop needs, GIS turns field variability into a strategic advantage.

    But precision only works if your data flows into action. That’s where SCSTech comes in. Our GIS solutions help AgTech teams move from scattered data to clear, usable insights, powering smarter irrigation models and crop plans that adapt to real-world conditions.

  • Using GIS Mapping to Identify High-Risk Zones for Earthquake Preparedness

    Using GIS Mapping to Identify High-Risk Zones for Earthquake Preparedness

    GIS mapping combines seismicity, ground conditions, building exposure, and evacuation routes into multi-layer, spatial models. This gives a clear, specific image of where the greatest dangers are — a critical function in disaster response software designed for earthquake preparedness.

    Using this information, planners and emergency responders can target resources, enhance infrastructure strength, and create effective evacuation plans individualized for the zones that require it most.

    In this article, we dissect how GIS maps pinpoint high-risk earthquake areas and why this spatial accuracy is critical to constructing wiser, life-saving readiness plans.

    Why GIS Mapping Matters for Earthquake Preparedness?

    When it comes to earthquake resilience, geography isn’t just a consideration — it’s the whole basis of risk. The key to minimal disruption versus disaster is where the infrastructure is located, how the land responds when stressed, and what populations are in the path.

    That’s where GIS mapping steps in — not as a passive data tool, but as a central decision engine for risk identification and GIS and disaster management planning.

    Here’s why GIS is indispensable:

    • Earthquake risk is spatially uneven. Some zones rest directly above active fault lines, others lie on liquefiable soil, and many are in structurally vulnerable urban cores. GIS doesn’t generalize — it pinpoints. It visualizes how these spatial variables overlap and create compounded risks.
    • Preparedness needs layered visibility. Risk isn’t just about tectonics. It’s about how seismic energy interacts with local geology, critical infrastructure, and human activity. GIS allows planners to stack these variables — seismic zones, building footprints, population density, utility lines — to get a granular, real-time understanding of risk concentration.
    • Speed of action depends on the clarity of data. During a crisis, knowing which areas will be hit hardest, which routes are most likely to collapse, and which neighborhoods lack structural resilience is non-negotiable. GIS systems provide this insight before the event, enabling governments and agencies to act, not react.

    GIS isn’t just about making maps look smarter. It’s about building location-aware strategies that can protect lives, infrastructure, and recovery timelines.

    Without GIS, preparedness is built on assumptions. With it, it’s built on precision.

    How GIS Identifies High-Risk Earthquake Zones

    How GIS Maps Earthquake Risk Zones with Layered Precision

    Not all areas within an earthquake-prone region carry the same level of risk. Some neighborhoods are built on solid bedrock. Others sit on unstable alluvium or reclaimed land that could amplify ground shaking or liquefy under stress. What differentiates a moderate event from a mass-casualty disaster often lies in these invisible geographic details.

    Here’s how it works in operational terms:

    1. Layering Historical Seismic and Fault Line Data

    GIS platforms integrate high-resolution datasets from geological agencies (like USGS or national seismic networks) to visualize:

    • The proximity of assets to fault lines
    • Historical earthquake occurrences — including magnitude, frequency, and depth
    • Seismic zoning maps based on recorded ground motion patterns

    This helps planners understand not just where quakes happen, but where energy release is concentrated and where recurrence is likely.

    2. Analyzing Geology and Soil Vulnerability

    Soil type plays a defining role in earthquake impact. GIS systems pull in geoengineering layers that include:

    • Soil liquefaction susceptibility
    • Slope instability and landslide zones
    • Water table depth and moisture retention capacity

    By combining this with surface elevation models, GIS reveals which areas are prone to ground failure, wave amplification, or surface rupture — even if those zones are outside the epicenter region.

    3. Overlaying Built Environment and Population Exposure

    High-risk zones aren’t just geological — they’re human. GIS integrates urban planning data such as:

    • Building density and structural typology (e.g., unreinforced masonry, high-rise concrete)
    • Age of construction and seismic retrofitting status
    • Population density during day/night cycles
    • Proximity to lifelines like hospitals, power substations, and water pipelines

    These layers turn raw hazard maps into impact forecasts, pinpointing which blocks, neighborhoods, or industrial zones are most vulnerable — and why.

    4. Modeling Accessibility and Emergency Constraints

    Preparedness isn’t just about who’s at risk — it’s also about how fast they can be reached. GIS models simulate:

    • Evacuation route viability based on terrain and road networks
    • Distance from emergency response centers
    • Infrastructure interdependencies — e.g., if one bridge collapses, what neighborhoods become unreachable?

    GIS doesn’t just highlight where an earthquake might hit — it shows where it will hurt the most, why it will happen there, and what stands to be lost. That’s the difference between reacting with limited insight and planning with high precision.

    Key GIS Data Inputs That Influence Risk Mapping

    Accurate identification of earthquake risk zones depends on the quality, variety, and granularity of the data fed into a GIS platform. Different datasets capture unique risk factors, and when combined, they paint a comprehensive picture of hazard and vulnerability.

    Let’s break down the essential GIS inputs that drive earthquake risk mapping:

    1. Seismic Hazard Data

    This includes:

    • Fault line maps with exact coordinates and fault rupture lengths
    • Historical earthquake catalogs detailing magnitude (M), depth (km), and frequency
    • Peak Ground Acceleration (PGA) values: A critical metric used to estimate expected shaking intensity, usually expressed as a fraction of gravitational acceleration (g). For example, a PGA of 0.4g indicates ground shaking with 40% of Earth’s gravity force — enough to cause severe structural damage.

    GIS integrates these datasets to create probabilistic seismic hazard maps. These maps often express risk in terms of expected ground shaking exceedance within a given return period (e.g., 10% probability of exceedance in 50 years).

    2. Soil and Geotechnical Data

    Soil composition and properties modulate seismic wave behavior:

    • Soil type classification (e.g., rock, stiff soil, soft soil) impacts the amplification of seismic waves. Soft soils can increase shaking intensity by up to 2-3 times compared to bedrock.
    • Liquefaction susceptibility indexes quantify the likelihood that saturated soils will temporarily lose strength, turning solid ground into a fluid-like state. This risk is highest in loose sandy soils with shallow water tables.
    • Slope and landslide risk models identify areas where shaking may trigger secondary hazards such as landslides, compounding damage.

    GIS uses Digital Elevation Models (DEM) and borehole data to spatially represent these factors. Combining these with seismic data highlights zones where ground failure risks can triple expected damage.

    3. Built Environment and Infrastructure Datasets

    Structural vulnerability is central to risk:

    • Building footprint databases detail the location, size, and construction material of each structure. For example, unreinforced masonry buildings have failure rates up to 70% at moderate shaking intensities (PGA 0.3-0.5g).
    • Critical infrastructure mapping covers hospitals, fire stations, water treatment plants, power substations, and transportation hubs. Disruption in these can multiply casualties and prolong recovery.
    • Population density layers often leverage census data and real-time mobile location data to model daytime and nighttime occupancy variations. Urban centers may see population densities exceeding 10,000 people per square kilometer, vastly increasing exposure.

    These datasets feed into risk exposure models, allowing GIS to calculate probable damage, casualties, and infrastructure downtime.

    4. Emergency Access and Evacuation Routes

    GIS models simulate accessibility and evacuation scenarios by analyzing:

    • Road network connectivity and capacity
    • Bridges and tunnels’ structural health and vulnerability
    • Alternative routing options in case of blocked pathways

    By integrating these diverse datasets, GIS creates a multi-dimensional risk profile that doesn’t just map hazard zones, but quantifies expected impact with numerical precision. This drives data-backed preparedness rather than guesswork.

    Conclusion 

    By integrating seismic hazard patterns, soil conditions, urban vulnerability, and emergency logistics, GIS equips utility firms, government agencies, and planners with the tools to anticipate failures before they happen and act decisively to protect communities, exactly the purpose of advanced methods to predict natural disasters and robust disaster response software.

    For organizations committed to leveraging cutting-edge technology to enhance disaster resilience, SCSTech offers tailored GIS solutions that integrate complex data layers into clear, operational risk maps. Our expertise ensures your earthquake preparedness plans are powered by precision, making smart, data-driven decisions the foundation of your risk management strategy.

  • The Role of Predictive Analytics in Driving Business Growth in 2025

    The Role of Predictive Analytics in Driving Business Growth in 2025

    Consumer behaviour is shifting faster than ever. Algorithms are making decisions before you do. And your gut instinct? It’s getting outpaced by businesses that see tomorrow coming before it arrives.

    According to a 2024 Gartner survey, 79% of corporate strategists say analytics, AI, and automation are critical to their success over the next two years. Many are turning to specialised AI/ML services to operationalise these priorities at scale.

    Markets are moving too fast for backward-looking plans. Today’s winning companies aren’t just reacting to change — they’re anticipating it. Predictive analytics gives you the edge by turning historical data into future-ready decisions faster than your competition can blink.

    If you’ve ever timed a campaign based on last year’s buying cycle, you’ve already used predictive instinct. But in 2025, instinct isn’t enough. You need a system that scales it.

    Where It Actually Moves the Needle — And Where It Doesn’t

    Let’s get real—predictive analytics isn’t a plug-and-play miracle. It’s a tool. Its value comes from where and how you apply it. Some companies see 10x ROI. Others walk away unimpressed. The difference? Focus.

    Predictive Analytics Engine

    A McKinsey report noted that companies using predictive analytics in key operational areas see up to 6% improvement in profit margins and 10% higher customer satisfaction scores. However, these results only show up when the use case is aligned with actual friction points. Especially when backed by an integrated AI/ML service that aligns models with on-the-ground decision triggers.

    Here’s where prediction delivers outsized returns:

    1. Demand Forecasting (Relevant for: Manufacturing, retail, and healthcare): These industries lose revenue when supply doesn’t match demand, either through excess inventory that expires or stockouts that miss sales. It helps businesses align production with real demand patterns, often region-specific or seasonal.
    2. Customer Churn Prediction (Relevant for: Telecom and BFSI): When customers leave quietly, the business loses long-term value without warning. What prediction does: It flags small changes in user behavior that often go unnoticed, like a drop in usage or payment delays, so retention teams can intervene early.
    3. Predictive Maintenance (Relevant for: Heavy machinery, logistics, and energy sectors): Unplanned downtime halts operations and damages client trust. It uses machine data—often analysed through an AI/ML service—to identify early signs of failure, so teams can act before breakdowns happen.
    4. Fraud Detection (Relevant for: Banking and insurance): As digital transactions scale, fraud becomes harder to detect through manual checks alone. Algorithms analyse transaction patterns and flag anomalies in real time—often faster and more accurately than audits.

    But not every use case delivers.

    Where It Fails—or Flatlines

    • When data is sparse or irregular. Prediction thrives on patterns. No patterns? No value.
    • When you’re trying to forecast rare, one-off events—like a regulatory upheaval or leadership shift.
    • When departments work in silos, hoarding insights instead of feeding them back into models.
    • When you deploy tools before identifying problems, a common mistake with off-the-shelf dashboards.

    Key Applications of Predictive Analytics for Business Growth

    Predictive analytics becomes valuable only when it integrates with core decision systems—those that determine how, when, and where a business allocates its capital, people, and priorities. Used correctly, it transforms lagging indicators into real-time levers for operational clarity. Below are not categories—but impact zones—where the application of predictive intelligence changes how growth is executed, not just reported.

    1. Customer acquisition and retention

    Retention is not a loyalty problem. It’s an attention problem. Businesses lose customers not when value disappears—but when relevance lapses. Predictive analytics identifies these lapses early.

    • By leveraging behavioural clustering and time-series models, high-performing businesses can detect churn signals long before customers take action.
    • According to a Forrester study, companies that operationalized churn prediction frameworks reported up to 15–20% improvement in customer lifetime value (CLV) by deploying targeted interventions when disengagement patterns first emerge.

    This is not segmentation. It’s micro-forecasting—where response likelihood is recalculated in real time across interaction channels.

    In B2C models, these drives offer timing and personalization. In B2B SaaS, it influences renewal forecasts and account management priorities. Either way, the growth engine no longer runs on intuition. It runs on modeled intent.

    2. Marketing and revenue operations

    Campaigns fail not because of creative gaps—but because they’re misaligned with demand timing. Predictive analytics changes that by eliminating the lag between audience insight and go-to-market execution.

    • By integrating external signals—like macroeconomic indicators, sector-specific sentiment, and real-time intent data—into media planning systems, marketing teams shift from reactive attribution to predictive conversion modeling. Such insights often come faster when powered by a reliable AI/ML service capable of digesting external and internal data streams.
    • This reduces CAC volatility and improves budget elasticity.

    In sales, predictive scoring systems ingest CRM data, email trails, past deal cycles, and intent signals to identify not just who is likely to close, but when and at what cost to serve.

    A McKinsey study noted that sales teams with mature predictive analytics frameworks closed deals 12–15% faster and achieved 10–20% higher conversion rates than those using standard lead scoring.

    3. Product strategy and innovation

    The traditional model of product development—build, launch, measure—is fundamentally reactive. Predictive analytics shifts this flow by identifying undercurrents in customer need before they surface as requests or complaints.

    • NLP models—typically deployed through an AI/ML service—run across support tickets, online reviews, and feedback forms, and extract friction themes at scale.
    • Layered with usage telemetry, companies can model not just what customers want next, but what will reduce churn and increase NPS with the lowest development cost.

    In hardware and manufacturing, predictive analytics ties into field service data and defect logs to anticipate which design improvements will yield the greatest operational return—turning product development into a value optimization function, not a roadmap gamble.

    4. Supply chain and operations

    Supply chains break not because of a lack of planning, but because of dependence on static planning. Predictive models inject fluidity—adapting forecasts based on upstream and downstream fluctuations in near real-time.

    • One electronics OEM layered weather data, regional demand shifts, and supplier capacity metrics into its forecasting models—cutting inventory holding costs by 22% and avoiding stockouts in two consecutive holiday seasons.
    • Beyond demand, predictive analytics enables logistics risk profiling, flagging geographies, vendors, or nodes that show early signals of disruption.

    It also supports capacity-aware scheduling—adjusting throughput based on absenteeism, machine wear signals, or raw material inconsistencies. This doesn’t require full automation. It requires precision frameworks that make manual interventions smarter, faster, and more aligned with system constraints.

    5. Finance and risk management

    Financial models typically operate on the assumption of linearity. Predictive analytics exposes the reality—that financial health is event-driven and behavior-dependent.

    • Revenue forecasting systems embedding signals like interest rate changes, currency volatility, and regional policy shifts improved forecast accuracy by up to 25%, according to PwC.
    • In credit and fraud, supervised models don’t just look for rule violations—but for breaks in pattern coherence, even when individual inputs appear safe.

    This is why predictive risk systems are no longer limited to banks. Mid-sized enterprises exposed to global vendors, multi-currency transactions, or digital assets are embedding fraud detection into operational controls—not waiting for post-event audits.

    Challenges in Implementing Predictive Analytics

    The failure rate of predictive analytics initiatives remains high, not because the technology is insufficient, but because most organizations misdiagnose what prediction actually requires. It is not a data visualization problem. It’s an integration problem. Below are the real constraints that separate signal from noise.

    1. Data infrastructure

    Predictive accuracy depends on historical depth, temporal granularity, and data context. Most organizations underestimate how fragmented or unstructured their data is, until the model flags inconsistent inputs.

    • According to IDC, only 32% of organizations have enterprise-wide data governance sufficient to support cross-functional predictive models.
    • Without normalized pipelines, real-time ingestion, and tagging standards, even advanced models collapse under ambiguity.

    2. Model reliability and explainability

    In regulated industries—finance, healthcare, insurance—accuracy alone isn’t enough. Explainability becomes critical.

    • Stakeholders need to understand why a model flagged a transaction, rejected a claim, or reprioritized a lead.
    • Black-box models like deep learning demand interpretability frameworks (e.g., LIME or SHAP) or hybrid models that balance clarity with accuracy.

    Without this transparency, trust erodes—and regulatory non-compliance becomes a serious risk.

    3. Siloed ownership

    Prediction has no value if insight stays in a dashboard. Yet many organizations keep data science isolated from sales, ops, or finance.

    • This leads to what Gartner calls the “insight-to-action gap.”
    • Models generate accurate outputs, but no one acts on them—either due to unclear ownership or because workflows aren’t built to accept predictive triggers.

    To close this, predictions must be embedded into decision architecture—CRM systems, scheduling tools, pricing engines—not just reporting layers.

    4. Talent scarcity

    Most businesses conflate data analytics with predictive modeling. But statistical reports aren’t predictive systems.

    • You don’t need someone to report what happened—you need people who build systems that act on what will happen.
    • That means hiring data engineers, ML ops architects, and domain-informed modelers—not spreadsheet analysts.

    This mismatch leads to failed pilots and dashboards that look impressive but fail to drive business impact.

    5. Change management

    The biggest friction point isn’t technical—it’s cultural.

    • Predictive systems challenge intuition. They force leaders to trust data over experience.
    • This only works when there’s executive alignment—when leadership is willing to move from authority-based decisions to model-informed strategy.

    Adoption requires not just access to tools, but governance models, feedback loops, and measurable accountability.

    What Business Growth Looks Like with Prediction Built-In

    When predictive analytics is done right, growth doesn’t look like fireworks. It looks like precision.

    • You don’t over-hire.
    • You don’t overstock.
    • You don’t launch in the wrong quarter.
    • You don’t spend weeks figuring out why shipments are delayed—because you already fixed it two cycles ago.

    The power of prediction is in consistency.

    And in mid-sized businesses, consistency is the difference between making payroll comfortably and cutting corners to survive Q4.

    In public health systems, predictive models helped reduce patient wait times by anticipating post-holiday surges in outpatient visits. The result? Less crowding. Faster care. Better resource planning.

    No billion-dollar transformation. Just friction, removed.

    This is where SCS Tech earns its edge.

    They don’t sell dashboards—they offer a tailored AI/ML service that solves recurring friction points using AI/ML architectures tailored to your reality.

    • If your shipment delays always happen in the same two regions,
    • If your production overruns always start with the same raw material,
    • If your customer complaints always spike on certain weekdays—

    That’s where they begin. They don’t drop a model and leave. They build prediction into your process to the point where it stops you from losing money.

    What to Look for If You Want to Explore Further

    Before bringing in predictive analytics, ask yourself:

    • Where are we routinely late in making calls?
    • Which part of the business costs more than it should—because we’re always reacting?
    • Do we have enough historical data tied to that problem?

    If the answer is yes, you’re not early. You’re already behind.

    That’s the entry point for SCS Tech. They don’t lead with tools. They start by identifying high-friction, recurring events that can be modelled—and then make that logic part of your system.

    Their strength isn’t variety. It’s pattern recognition across sectors where delay costs money: logistics bottlenecks, vendor overruns, and churn without warning. SCS Tech knows how to operationalise prediction—not as a shiny overlay but as a layer that runs quietly behind the scenes.

    Final Thoughts

    Most business problems aren’t surprising—they just keep resurfacing because we’re too late to catch them. Prediction changes that. It gives you leverage, not hindsight.

    This isn’t about being futuristic. It’s about preventing wasted spend, lost hours, and missed quarters.

    If you’re running a mid-sized business and are tired of reacting late, talk to SCS Tech India. Start with one recurring issue. If it’s predictable, we’ll help you systemize the fix—and prove the return in weeks, not quarters.

    FAQs

    We already use dashboards and reports—how is this different?

    Dashboards tell you what has already happened. Predictive analytics tells you what’s likely to happen next. It moves you from reactive decision-making to proactive planning. Instead of seeing a sales dip after it occurs, prediction can flag the drop before it shows up on reports, giving you time to correct the course.

    Do we need a massive data science team to get started?

    No. You don’t need an in-house AI lab. Most companies start with external partners or off-the-shelf platforms tailored to their domain. The critical part isn’t the tool—it’s the clarity of the problem you’re solving. You’ll need clean data, domain insight, and a team that can translate the output into action. That’s more important than building everything from scratch.

    Can we apply predictive analytics to small or one-time projects?

    You can try—but it won’t deliver much value. Prediction is best suited for ongoing, high-volume decisions. Think of recurring purchases, ongoing maintenance, repeat fraud attempts, etc. If you’re testing a new product or entering a new market with no history to learn from, traditional analysis or experimentation will serve you better.


  • How GIS Mapping Services Support Climate Change Analysis and Long-Term Weather Forecasting

    How GIS Mapping Services Support Climate Change Analysis and Long-Term Weather Forecasting

    What if you could foresee rising seas, vanishing forests, or sweltering cities years before they become headlines? The key to this foresight is GIS mapping services.

    Far from being just another tool, GIS serves as a compass for navigating the complexities of a warming planet, enabling scientists, policymakers, and industries to act with unprecedented clarity.

    In this blog, we will explore how GIS mapping services support climate change analysis and long-term weather forecasting, breaking down complex processes into simple, actionable insights.

    How GIS Mapping Services Support Climate Change Analysis

    Monitoring Environmental Changes

    GIS mapping is indispensable in monitoring shifts in the natural world, from rising temperatures to shrinking glaciers.

    Temperature Tracking

    GIS enables accurate tracking of temperature variations over time:

    • Spatial Analysis: Methods such as Kriging and Inverse Distance Weighting (IDW) transform weather station data into highly detailed temperature maps. These maps indicate anomalies, allowing scientists to pick up on unusual trends.
    • Time Series Analysis: By combining historical data, GIS allows for determining seasonal patterns and long-term warming trends. For example, NOAA uses GIS to show how temperatures have dramatically increased since the late 20th century.

    Deforestation Monitoring

    Through the absorption of carbon dioxide, forests play a critical role; GIS mapping services tracks the health of these forests in the following way:

    • Remote Sensing: Satellite images, as in the case of Landsat, use vegetation indices such as NDVI, in which those with healthy forests represent areas of no deforestation.
    • Detection Change Algorithms: GIS detects changes between image times and reports forest loss measurement. GIS maps indicate how agricultural activities lead to deforestation.

    Glacier and Ice Cap Analysis

    GIS is instrumental in studying glaciers and ice caps, which are critical indicators of climate change:

    • Glacial Retreat Monitoring: Comparing the satellite images for decades, GIS quantifies the retreat of Himalayan glaciers, affecting water supply to millions.
    • Ice Mass Balance Studies: Using the elevation models in conjunction with the satellite data, GIS computes the ice loss and its contribution to the rise in sea levels.

    Air Quality Assessment

    Climate change increases poor air quality, but it offers a solution through GIS.

    • Source Pollution Mapping: Emission data are combined with weather models to create a GIS mapping of city pollution hotspots.
    • Health Impact Studies: Using GIS, policymakers link air quality data with health records to pinpoint areas for interventions that can reach vulnerable communities.

    Risk Assessment and Disaster Response

    Climate change is on the increase with the frequency of natural disasters. Using GIS maps helps assess risk and improve preparedness.

    Flood Risk Mapping

    Flooding is a perilous threat, and GIS can predict and mitigate the impact:

    • Hydrological Modeling: GIS can identify flood-prone areas and guide land-use planning with rainfall data and elevation maps.
    • Vulnerability Assessments: GIS overlays population density with flood risk zones, prioritizing resources for the most at-risk communities.

    Disaster Recovery Planning

    GIS streamlines response efforts during and after extreme weather events:

    • Real-Time Data Integration: In hurricanes or floods, GIS integrates real-time data (e.g., social media updates) to help emergency responders.
    • Resource Allocation Mapping: Recovery efforts are optimized by mapping available resources like shelters and medical facilities against affected areas.

    Urban Heat Island Mitigation

    Urban areas often trap more heat, worsening health risks during hot weather:

    • Heat Mapping: GIS finds the urban heat island by analyzing the land surface temperatures. It then aids in identifying priority cooling areas for planting trees or reflective rooftops.
    • Policy Development: Based on GIS-based findings, cities are developing a plan to reduce the risk of heatwave attacks.

    Climate Change Mitigation Strategy

    GIS contributes significantly to generating environmentally friendly alternatives that mitigate climate change.

    Carbon Emission Reduction

    Through GIS data analysis, carbon emissions can be decreased as data-informed decision-making helps.

    • Emission Mapping: GIS identifies emission hotspots by visualizing sources of greenhouse gases, such as industrial sites or busy highways.
    • Targeted Solutions: Cities can use this data to implement public transportation upgrades or renewable energy projects in high-emission areas.

    Sustainable Resource Management

    GIS promotes eco-friendly practices by guiding resource management:

    • Renewable Energy Site Selection: GIS identifies ideal locations for solar farms or wind turbines by analyzing sunlight exposure and weather patterns.
    • Land Use Planning: GIS data integration ensures new developments do not go against economic growth without preserving the environment.

    How GIS Mapping Services Support Long-Term Weather Forecasting

    Accurate weather forecasts are essential for agriculture, disaster preparedness, and energy management. It is made possible with GIS mapping services.

    Data Collection and Integration

    GIS collects and integrates various datasets to improve forecasting:

    • Sources: Data from weather stations, satellites, and global climate models offer a holistic view of atmospheric conditions.
    • Integration Techniques: Techniques like Kalman filtering combine real-time observations with model predictions to improve accuracy.

    Forecasting Techniques

    • Numerical Weather Prediction (NWP): Mathematical models mimic the atmosphere’s behavior, given the current state. GIS displays these results, making interpreting temperature or rainfall patterns easy.
    • Ensemble Forecasting: Running multiple simulations with slightly different initial conditions, GIS offers probabilistic forecasts that help planners plan for various eventualities.

    Visualization and Scenario Analysis

    GIS brings weather data alive:

    • Thematic Maps: Shows patterns such as drought-prone areas or the amount of expected rain. This transforms complex data in a way that is easily understandable to stakeholders.
    • What-If Scenarios: Users can simulate different scenarios, including rising greenhouse levels, to begin planning adaptive strategies.

    Conclusion

    GIS mapping services are transforming how we understand and tackle climate change. Leading GIS consultants and GIS companies in Mumbai are helping provide scientists, policymakers, and communities with actionable insights—from tracking rising temperatures to mitigating urban heat islands. Their expertise in GIS plays a key role in long-term weather forecasting, ensuring better planning—whether it’s safeguarding crops or preparing for floods.

    With increasing climate challenges, GIS mapping services will remain at the forefront to guide efforts toward a sustainable and resilient future. For innovative and reliable GIS solutions, SCS Tech stands as the ideal partner, empowering organizations with cutting-edge technology to tackle climate change effectively.

  • Understanding Big Data in GIS Applications: How It Shapes Our World

    Understanding Big Data in GIS Applications: How It Shapes Our World

    What if we could predict traffic jams, track pollution spread, and optimize city planning—all in real-time? Significant data infusion into geographical information systems (GIS) and advanced GIS services has made all these possible. The geospatial data analytics market has been growing globally, valued at $88.3 billion since 2020. This growth shows how organizations are using big data in GIS applications to make smarter decision

    In this blog, let’s discuss how Big Data is revolutionizing GIS applications, from cloud-based platforms to drone mapping services in India, and how GIS and IoT solve real-world problems.

    What Is GIS and Why Big Data Matters?

    GIS is a tool that enables us to visualize, analyze, and interpret spatial data—that is, data associated with specific locations on Earth. Think of it as a map with multiple layers of information, showing everything from land use to population density. Paired with Big Data—massive datasets with variety and speed—GIS transforms into a powerhouse for understanding complex relationships.

    For instance:

    • Big Data from IoT Sensors: The sensors in smart cities monitor real-time air quality, traffic, and temperature and feed into GIS systems with updated knowledge.
    • Crowdsourced Data: Platforms like OpenStreetMap enable individuals to share local knowledge, which feeds into maps with detailed information and accuracy.

    How Big Data Empowers GIS Applications

    Big data in GIS applications transforming mapping
    Big data in GIS applications transforming mapping

    Big Data empowers GIS in ways that methods of the past could not. Here’s how:

    1. Urban Planning Made Smarter

    • Land Use Analysis: Satellite imagery coupled with socioeconomic data helps planners track changes in land use over time. This ensures cities grow sustainably.
    • Transportation Modeling: GPS data from vehicles helps optimize routes and reduce congestion. For example, public transport systems can change routes dynamically based on traffic patterns.
    • Community Engagement: Interactive maps allow citizens to visualize and comment on urban projects, fostering transparency.

    2. Disaster Management: Saving Lives

    • Risk Assessment: GIS analyzes weather patterns and historical data to pinpoint areas at risk of flooding or earthquakes.
    • Real-Time Monitoring: During disasters, data from IoT devices and social media feeds helps responders understand the situation instantly.
    • Post-Disaster Recovery: Aerial drone images provide clear visuals of affected areas, speeding up relief efforts.

    3. Environmental Monitoring: Protecting the Planet

    • Climate Studies: Long-term satellite data reveals how vegetation and glaciers change over time due to global warming.
    • Biodiversity Conservation: GIS maps endangered species’ habitats, helping identify critical areas that require conservation.
    • Pollution Tracking: Air quality sensors feed into GIS systems that track how pollution spreads throughout cities, helping policymakers take action.

    4. Public Health: Monitoring and Controlling Diseases

    • Outbreak Mapping: GIS helped to visualize the case patterns in the COVID-19 pandemic. It allowed authorities to focus their resources on high-risk areas.
    • Resource Allocation: Through GIS, hospitals and clinics analyze population density in the area to provide better services.

    5. Logistics and Transportation: Moving Smarter

    • Route Optimization: Companies like UPS apply GIS to analyze traffic and deliver packages faster.
    • Fleet Management: GPS-enabled trucks feed the GIS system with location data, thus enabling real-time tracking and efficient route planning.

    Cutting-edge technologies in GIS

    GIS is growing with exciting technologies that make it even more powerful:

    Cloud-Based GIS Platforms

    Cloud technology has revolutionized GIS, making it accessible and scalable:

    • Real-Time Data Processing: Platforms like Esri’s ArcGIS Online allow seamless spatial data sharing and processing.
    • Collaboration: Teams can work on the same map from anywhere, fostering innovation and efficiency.
    • Cost-Effectiveness: Cloud-based GIS eliminates the need for expensive hardware, making it ideal for organizations of all sizes.

    Drone Mapping Services in India

    India’s rapid adoption of drone technology is transforming GIS applications:

    • Precision Mapping: Drones take high-resolution images for infrastructure projects and agriculture.
    • Disaster Response: Drones provide critical aerial visuals to aid recovery after natural disasters.
    • Urban Planning: Cities like Bangalore use drone data to plan better transportation and housing.

    GIS and IoT Applications

    IoT devices, from weather stations to traffic sensors, feed GIS systems with valuable real-time data:

    • Smart Cities: Sensors monitor everything from electricity usage to water flow, making for more innovative and sustainable urban environments.
    • Agriculture: IoT-enabled sensors monitor soil moisture and crop health for farmers to optimize yields.
    • Environmental Monitoring: Networks of IoT devices measure air and water quality, feeding GIS with critical ecological data.

    Challenges in Integrating Big Data with GIS

    With all its benefits, big data in GIS applications is fraught with its challenges:

    • Data Quality: Inaccurate or out-of-date data can result in poor decisions. Validation is a continuous process.
    • Technical Expertise: Professionals must be trained in geospatial analysis and data science, which requires extensive training.
    • Privacy Issues: The use of personal location data raises ethical issues. Clear policies and transparency are critical to building public trust.

    Future Directions for Big Data in GIS

    The integration of emerging technologies will redefine GIS:

    • AI and Machine Learning: These technologies will further power predictive analytics in GIS, automating pattern recognition and forecasting.
    • Cloud-Based GIS Platforms: Cloud storage will make smaller organizations more accessible and collaborative.
    • Drone Mapping Services: Drones equipped with GIS technology will continue to provide high-resolution data for agriculture, urban planning, and disaster response in India.
    • GIS and IoT Applications: IoT networks expand the scope of real-time monitoring from innovative city management to wildlife conservation.

    Conclusion

    The intersection of big data in GIS applications has opened doors for new understanding and solutions to complex geographic problems. From improving urban planning to enhancing disaster response and protecting the environment, GIS in India is playing a vital role in shaping a more innovative and sustainable world.

    As cloud-based GIS platforms and drone mapping services in India continue to evolve, companies like SCS Tech play an important role in driving innovation and delivering robust solutions. By addressing challenges such as data quality and privacy, we can utilize the full potential of Big Data in GIS applications, creating solutions that truly make a difference.


  • How Artificial Intelligence in Disaster Management Software Is Saving Lives?

    How Artificial Intelligence in Disaster Management Software Is Saving Lives?

    What if we could turn chaos into clarity during disasters? Since 1990, floods have caused $50 billion in damages and impacted millions in India. Knowing about a disaster before it strikes could give communities time to prepare and respond effectively. That’s where Artificial Intelligence is turning this possibility into a reality. From issuing early warnings for hurricanes to guiding rescue operations during floods, AI is revolutionizing disaster management.

    In this blog, let’s explore how AI in disaster management software transforms predictions, responses, and recovery efforts to save lives.

    How Artificial Intelligence in Disaster Management Software Is Saving Lives?

    AI in disaster management software enhancing life-saving efforts
    AI in disaster management software enhancing life-saving efforts

    Artificial Intelligence (AI) revolutionizes disaster management by permitting more accurate predictions, speedy responses, and efficient recoveries. AI enables advanced algorithms, and real-time data is fed to disaster management software to soften the impact of natural and artificial disasters.

    1. Disaster forecasting through AI

    AI has come as one of the significant transformations that AI has undergone to improve disaster management systems. Through analyzing vast amounts of data and finding patterns, the chances of predicting and, thus, preparing for any disaster are primarily enhanced.

    Data Collection by AI

    AI collects data from different sources, and this includes:

    • Weather data, which can track storms, hurricanes, and cyclones
    • A seismic activity record is used to identify the initial seismic signals of an earthquake.
    • Historical data to identify trends of disaster recurrences in certain areas.

    This integrated analysis helps accurately predict when and where disasters might occur. For instance, AI can scan satellite images to monitor ocean temperatures and predict the cyclone’s formation.

    Risk Assessment

    AI evaluates the potential damage caused by disasters by assessing:

    • Population density: Determining areas where the disaster would impact the most people.
    • Infrastructure weaknesses: This highlights the weak points such as bridges, dams, or flood-prone neighborhoods.
    • Environmental factors: These are natural features such as forests or water bodies that may affect the intensity of disasters.

    This helps governments and agencies to plan better and provide more resources to high-risk areas.

    Early Warning Systems

    Machine learning models are trained on historical data, predicting disaster patterns and providing early warnings. These warnings:

    • Give communities enough time to evacuate or prepare.
    • Allowing authorities to preposition emergency supplies, including food, water, and medical kits.

    For instance, AI-based flood prediction systems use rainfall, river levels, and soil saturation data to predict floods days ahead of time. This helps save lives and reduce property damage.

    2. Real-Time Monitoring of Disasters

    When disasters occur, the difference between life and death can be a matter of having accurate information in real-time. AI shines in monitoring unfolding events and guiding responders in real-time.

    Live Data Analysis

    AI processes live feeds from sources like:

    • Drones: Taking aerial views of disaster-stricken areas to identify damage and locate stranded individuals.
    • Satellites: Offering large-scale images to track the spread of disasters such as wildfires or floods.
    • IoT Sensors: Track water levels, air quality, and structural strength in disaster areas.

    Processing this information in real-time, AI provides actionable insight to the emergency teams to determine the nature of the situation and plan for it.

    Anomaly Detection

    AI constantly monitors the critical parameters and detects anomalies that might lead to further deterioration. Such anomalies could be:

    • Rising water levels above flood safety levels.
    • Rapidly rising temperatures in a forested area potentially indicate wildfires.
    • Gas leaks in earthquake-damaged industrial areas.

    The detection alerts the responders, who can take prompt action before further damage is done.

    Situational Awareness

    AI-based GIS creates comprehensive maps that outline the following:

    • Storm-inundated areas
    • Affected areas due to wildfires and landslides
    • Safe zones for evacuation or relief operations.

    These maps enable better resource allocation so that aid would first reach the most vulnerable areas. For instance, AI-enhanced drones can identify stranded victims and direct rescue boats to that area during floods.

    3. Response Automation

    With AI able to automate critical tasks in the response function, emergency operations become swift and efficient with fewer chances of delay and error.

    Optimized Dispatch

    AI orders distress calls according to priority and determines their urgency and location. It may be demonstrated as below:

    • Calls from severely affected areas will be prioritized over other less urgent requests.
    • AI systems scan traffic conditions to route emergency vehicles to destinations as quickly as possible.

    This ensures that ambulances, fire trucks, and rescue teams reach the victims in need much faster, even in the most chaotic environment.

    Traffic Management

    In evacuations, traffic congestion is one of the biggest threats to lives. AI systems scan traffic patterns in real-time and recommend:

    • Alternative routes to avoid gridlocks.
    • Safe evacuation routes for big crowds.

    AI will give the safest route to avoid danger zones during a wildfire, ensuring civilians and emergency responders stay safe.

    The Future of AI in Disaster Management Software

    The use of AI in disaster management is getting stronger with every passing day. Here’s what might be in store:

    • Improved Predictive Models: AI will predict disasters even more accurately with better algorithms and data.
    • Real-Time Adaptation: AI systems would change responses dynamically in response to real-time updates to be efficient.
    • Collaboration Tools: Future AI systems enable easy data exchange among government agencies, NGOs, and AI technology companies.
    • Integration with IoT: AI-based incident management systems work with IoT devices like smart sensors to monitor critical parameters like water level and air quality in real-time.

    For instance, in flood-prone areas, AI, in conjunction with IoT sensors, can facilitate real-time updates that inform people in advance to evacuate in time.

    Conclusion

    Artificial Intelligence changes the face of disaster management software by saving lives through accurate predictions, swift reactions, and intelligent resource allocation. AI ensures people obtain information immediately by sending early warnings and real-time updates.

    In countries with frequent natural disasters, we must use AI-driven tools to reduce damage and protect communities. These tools do not only help us prepare but also respond better during emergencies. Companies like SCS Tech drive these innovations to build safer and more resilient communities and tap into the power of technology to save lives.