Tag: #businesssolution

  • What an IT Consultant Actually Does During a Major Systems Migration

    What an IT Consultant Actually Does During a Major Systems Migration

    System migrations don’t fail because the tools were wrong. They fail when planning gaps go unnoticed, and operational details get overlooked. That’s where most of the risk lies, not in execution, but in the lack of structure leading up to it.

    If you’re working on a major system migration, you already know what’s at stake: missed deadlines, broken integrations, user downtime, and unexpected costs. What’s often unclear is what an IT consultant actually does to prevent those outcomes.

    This article breaks that down. It shows you what a skilled consultant handles before, during, and after migration, not just the technical steps, but how the entire process is scoped, sequenced, and stabilized. An experienced IT consulting firm brings that orchestration by offering more than technical support; it provides migration governance end-to-end.

    What a Systems Migration Actually Involves

    System migration is not simply relocating data from a source environment to a target environment. It is a multi-layered process with implications on infrastructure, applications, workflows, and in most scenarios, how entire teams function once migrated.

    System migration is fundamentally a process of replacing or upgrading the infrastructure of an organization’s digital environment. It may be migrating from legacy to contemporary systems, relocating workloads to the cloud, or combining several environments into one. Whatever the size, however, the process is not usually simple.

    Why? Because errors at this stage are expensive.

    • According to Bloor Research, 80% of ERP projects run into data migration issues.
    • Planning gaps often lead to overruns. Projects can exceed budgets by up to 30% and delay timelines by up to 41%.
    • In more severe cases, downtime during migration costs range from $137 to $9,000 per minute, depending on company size and system scale.

    That’s why companies do not merely require a service provider. They need an experienced IT consultancy that can translate technical migration into strategic, business-aligned decisions from the outset.

    A complete system migration will involve:

    “6 Key Phases of a System Migration”

    Key Phases of a System Migration

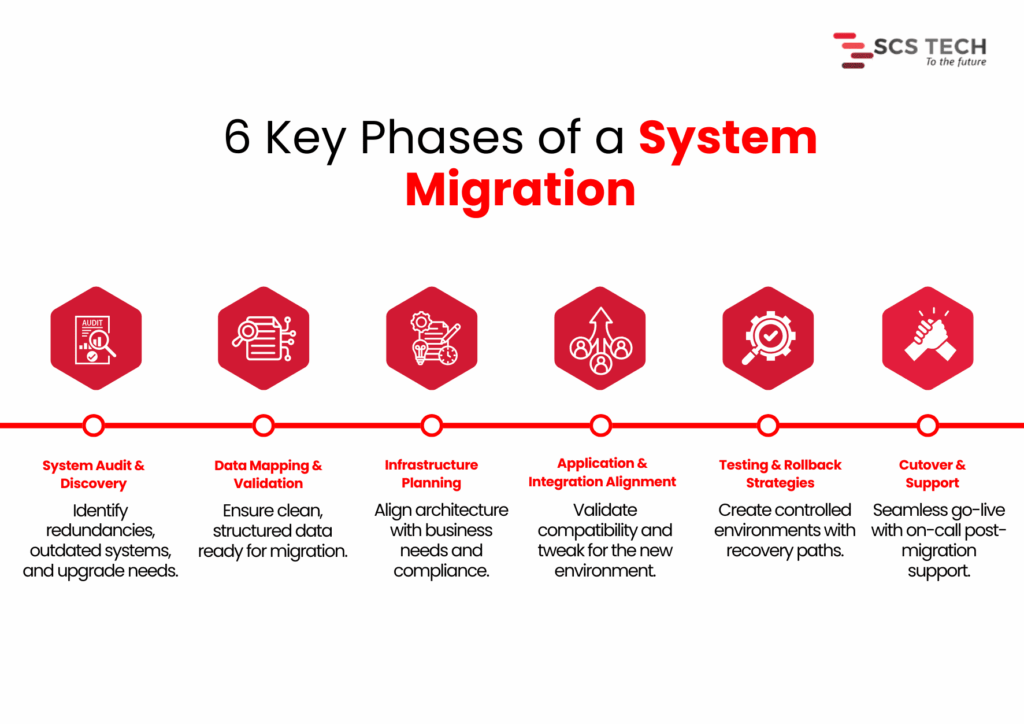
    • System audit and discovery — Determining what is being used, what is redundant, and what requires an upgrade.
    • Data mapping and validation — Satisfying that key data already exists, needs to be cleaned up, and is ready to be transferred without loss or corruption.
    • Infrastructure planning — Aligning the new systems against business objectives, user load, regulatory requirements, and performance requirements.
    • Application and integration alignment — Ensuring that current tools and processes are accommodated or modified for the new configuration.
    • Testing and rollback strategies — Minimizing service interruption by testing everything within controlled environments.
    • Cutover and support — Handling go-live transitions, reducing downtime, and having post-migration support available.

    Each of these stages carries its own risks. Without clarity, preparation, and skilled handling, even minor errors in the early phase can multiply into budget overruns, user disruption, or worse, permanent data loss.

    The Critical Role of an IT Consultant: Step by Step

    When system migration is on the cards, technical configuration isn’t everything. How the project is framed, monitored, and managed is what typically determines success.

    At SCS Tech, we own up to making that framework explicit from the beginning. We’re not just executioners. We remain clear through planning, coordination, testing, and transition, so the migration can proceed with reduced risk and improved decisions.

    Here, we’ve outlined how we work on large migrations, what we do, and why it’s important at every stage.

    Pre-Migration Assessment

    Prior to making any decisions, we first figure out what the world is like today. This is not a technical exercise. How systems are presently configured, where data resides, and how it transfers between tools, all of this has a direct impact on how a migration needs to be planned.

    We treat the pre-migration assessment as a diagnostic step. The goal is to uncover potential risks early, so we don’t run into them later during cutover or integration. We also use this stage to help our clients get internal clarity. That means identifying what’s critical, what’s outdated, and where the most dependency or downtime sensitivity exists.

    Here’s how we run this assessment in real projects:

    • First, we conduct a technical inventory. We list all current systems, how they’re connected, who owns them, and how they support your business processes. This step prevents surprises later. 
    • Next, we evaluate data readiness. We profile and validate sample datasets to check for accuracy, redundancy, and structure. Without clean data, downstream processes break. Industry research shows projects regularly go 30–41% over time or budget, partly due to poor data handling, and downtime can cost $137 to $9,000 per minute, depending on scale.
    • We also engage stakeholders early: IT, finance, and operations. Their insights help us identify critical systems and pain points that standard tools might miss. A capable IT consulting firm ensures these operational nuances are captured early, avoiding assumptions that often derail the migration later.

    By handling these details up front, we significantly reduce the risk of migration failure and build a clear roadmap for what comes next.

    Migration Planning

    Once the assessment is done, we shift focus to planning how the migration will actually happen. This is where strategy takes shape, not just in terms of timelines and tools, but in how we reduce risk while moving forward with confidence.

    1. Mapping Technical and Operational Dependencies

    Before we move anything, we need to know how systems interact, not just technically, but operationally. A database may connect cleanly to an application on paper, but in practice, it may serve multiple departments with different workflows. We review integration points, batch jobs, user schedules, and interlinked APIs to avoid breakage during cutover.

    Skipping this step is where most silent failures begin. Even if the migration seems successful, missing a hidden dependency can cause failures days or weeks later.

    2. Defining Clear Rollback Paths

    Every migration plan we create includes defined rollback procedures. This means if something doesn’t work as expected, we can restore the original state without creating downtime or data loss. The rollback approach depends on the architecture; sometimes it’s snapshot-based, and sometimes it involves temporary parallel systems.

    We also validate rollback logic during test runs, not after failure. This way, we’re not improvising under pressure.

    3. Choosing the Right Migration Method

    There are typically two approaches here:

    • Big bang: Moving everything at once. This works best when dependencies are minimal and downtime can be tightly controlled.
    • Phased: Moving parts of the system over time. This is better for complex setups where continuity is critical.

    We don’t make this decision in isolation. Our specialized IT consultancy team helps navigate these trade-offs more effectively by aligning the migration model with your operational exposure and tolerance for risk.

    Toolchain & Architecture Decisions

    Choosing the right tools and architecture shapes how smoothly the migration proceeds. We focus on precise, proven decisions, aligned with your systems and business needs.

    We assess your environment and recommend tools that reduce manual effort and risk. For server and VM migrations, options like Azure Migrate, AWS Migration Hub, or Carbonite Migrate are top choices. According to Cloudficient, using structured tools like these can cut manual work by around 40%. For database migrations, services like AWS DMS or Google Database Migration Service automate schema conversion and ensure consistency.

    We examine if your workloads integrate with cloud-native services, such as Azure Functions, AWS Lambda, RDS, or serverless platforms. Efficiency gain makes a difference in the post-migration phase, not just during the move itself.

    Unlike a generic vendor, a focused IT consulting firm selects tools based on system dynamics, not just brand familiarity or platform loyalty.

    Risk Mitigation & Failover Planning

    Every migration has risks. It’s our job at SCS Tech to reduce them from the start and embed safeguards upfront.

    • We begin by listing possible failure points, data corruption, system outages, and performance issues, and rate them by impact and likelihood. This structured risk identification is a core part of any mature information technology consulting engagement, ensuring real-world problems are anticipated, not theorized.
    • We set up backups, snapshots, or parallel environments based on business needs. Blusonic recommends pre-migration backups as essential for safe transitions. SCSTech configures failover systems for critical applications so we can restore service rapidly in case of errors.

    Team Coordination & Knowledge Transfer

    Teams across IT, operations, finance, and end users must stay aligned. 

    • We set a coordinated communication plan that covers status updates, cutover scheduling, and incident escalation.
    • We develop clear runbooks that define who does what during migration day. This removes ambiguity and stops “who’s responsible?” questions in the critical hours.
    • We set up shadow sessions so your team can observe cutover tasks firsthand, whether it’s data validation, DNS handoff, or system restart. This builds confidence and skills, avoiding post-migration dependency on external consultants.
    • After cutover, we schedule workshops covering:
    • System architecture changes
    • New platform controls and best practices
    • Troubleshooting guides and escalation paths

    These post-cutover workshops are one of the ways information technology consulting ensures your internal teams aren’t left with knowledge gaps after going live. By documenting these with your IT teams, we ensure knowledge is embedded before we step back.

    Testing & Post-Migration Stabilization

    A migration isn’t complete when systems go live. Stabilizing and validating the environment ensures everything functions as intended.

    • We test system performance under real-world conditions. Simulated workloads reveal bottlenecks that weren’t visible during planning.
    • We activate monitoring tools like Azure Monitor or AWS CloudWatch to track critical metrics, CPU, I/O, latency, and error rates. Initial stabilization typically takes 1–2 weeks, during which we calibrate thresholds and tune alerts.

    After stabilization, we conduct a review session. We check whether objectives, such as performance benchmarks, uptime goals, and cost limits, were met. We also recommend small-scale optimizations.

    Conclusion

    A successful migration of the system relies less on the tools and more on the way the process is designed upfront. Bad planning, lost dependencies, and poorly defined handoffs are what lead to overruns, downtime, and long-term disruption.

    It’s for this reason that the work of an IT consultant extends beyond execution. It entails converting technical complexity into simple decisions, unifying teams, and constructing the mitigations that ensure the migration remains stable at each point.

    This is what we do at SCS Tech. Our proactive IT consultancy doesn’t just react to migration problems; it preempts them with structured processes, stakeholder clarity, and tested fail-safes.

    We assist organizations through each stage from evaluation and design to testing and after-migration stabilization, without unnecessary overhead. Our process is based on system-level thinking and field-proven procedures that minimize risk, enhance clarity, and maintain operations while changes occur unobtrusively in the background.

    SCS Tech offers expert information technology consulting to scope the best approach, depending on your systems, timelines, and operational priorities.

  • The ROI of Sensor-Driven Asset Health Monitoring in Midstream Operations

    The ROI of Sensor-Driven Asset Health Monitoring in Midstream Operations

    In midstream, a single asset failure can halt operations and burn through hundreds of thousands in downtime and emergency response.

    Yet many operators still rely on time-based checks and manual inspections — methods that often catch problems too late, or not at all.

    Sensor-driven asset health monitoring flips the model. With real-time data from embedded sensors, teams can detect early signs of wear, trigger predictive maintenance, and avoid costly surprises. 

    This article unpacks how that visibility translates into real, measurable ROI. This article unpacks how that visibility translates into real, measurable ROI, especially when paired with oil and gas technology solutions designed to perform in high-risk, midstream environments.

    What Is Sensor-Driven Asset Health Monitoring in Midstream?

    In midstream operations — pipelines, storage terminals, compressor stations — asset reliability is everything. A single pressure drop, an undetected leak, or delayed maintenance can create ripple effects across the supply chain. That’s why more midstream operators are turning to sensor-driven asset health monitoring.

    At its core, this approach uses a network of IoT-enabled sensors embedded across critical assets to track their condition in real time. It’s not just about reactive alarms. These sensors continuously feed data on:

    • Pressure and flow rates
    • Temperature fluctuations
    • Vibration and acoustic signals
    • Corrosion levels and pipeline integrity
    • Valve performance and pump health

    What makes this sensor-driven model distinct is the continuous diagnostics layer it enables. Instead of relying on fixed inspection schedules or manual checks, operators gain a live feed of asset health, supported by analytics and thresholds that signal risk before failure occurs.

    In midstream, where the scale is vast and downtime is expensive, this shift from interval-based monitoring to real-time condition-based oversight isn’t just a tech upgrade — it’s a performance strategy.

    Sensor data becomes the foundation for:

    • Predictive maintenance triggers
    • Remote diagnostics
    • Failure pattern analysis
    • And most importantly, operational decisions grounded in actual equipment behavior

    The result? Fewer surprises, better safety margins, and a stronger position to quantify asset reliability — something we’ll dig into when talking ROI.

    Key Challenges in Midstream Asset Management Without Sensors

    Risk Without Sensor-Driven Monitoring

    Without sensor-driven monitoring, midstream operators are often flying blind across large, distributed, high-risk systems. Traditional asset management approaches — grounded in manual inspections, periodic maintenance, and lagging indicators — come with structural limitations that directly impact reliability, cost control, and safety.

    Here’s a breakdown of the core challenges:

    1. Delayed Fault Detection

    Without embedded sensors, operators depend on scheduled checks or human observation to identify problems.

    • Leaks, pressure drops, or abnormal vibrations can go unnoticed for hours — sometimes days — between inspections.
    • Many issues only become visible after performance degrades or equipment fails, resulting in emergency shutdowns or unplanned outages.

    2. Inability to Track Degradation Trends Over Time

    Manual inspections are episodic. They provide snapshots, not timelines.

    • A technician may detect corrosion or reduced valve responsiveness during a routine check, but there’s no continuity to know how fast the degradation is occurring or how long it’s been developing.
    • This makes it nearly impossible to predict failures or plan proactive interventions.

    3. High Cost of Unplanned Downtime

    In midstream, pipeline throughput, compression, and storage flow must stay uninterrupted.

    • An unexpected pump failure or pipe leak doesn’t just stall one site — it disrupts the supply chain across upstream and downstream operations.
    • Emergency repairs are significantly more expensive than scheduled interventions and often require rerouting or temporary shutdowns.

    A single failure event can cost hundreds of thousands in downtime, not including environmental penalties or lost product.

    4. Limited Visibility Across Remote or Hard-to-Access Assets

    Midstream infrastructure often spans hundreds of miles, with many assets located underground, underwater, or in remote terrain.

    • Manual inspections of these sites are time-intensive and subject to environmental and logistical delays.
    • Data from these assets is often sparse or outdated by the time it’s collected and reported.

    Critical assets remain unmonitored between site visits — a major vulnerability for high-risk assets.

    5. Regulatory and Reporting Gaps

    Environmental and safety regulations demand consistent documentation of asset integrity, especially around leaks, emissions, and spill risks.

    • Without sensor data, reporting is dependent on human records, often inconsistent and subject to audits.
    • Missed anomalies or delayed documentation can result in non-compliance fines or reputational damage.

    Lack of real-time data makes regulatory defensibility weak, especially during incident investigations.

    6. Labor Dependency and Expertise Gaps

    A manual-first model heavily relies on experienced field technicians to detect subtle signs of wear or failure.

    • As experienced personnel retire and talent pipelines shrink, this approach becomes unsustainable.
    • Newer technicians lack historical insight, and without sensors, there’s no system to bridge the knowledge gap.

    Reliability becomes person-dependent instead of system-dependent.

    Without system-level visibility, operators lack the actionable insights provided by modern oil and gas technology solutions, which creates a reactive, risk-heavy environment.

    This is exactly where sensor-driven monitoring begins to shift the balance, from exposure to control.

    Calculating ROI from Sensor-Driven Monitoring Systems

    For midstream operators, investing in sensor-driven asset health monitoring isn’t just a tech upgrade — it’s a measurable business case. The return on investment (ROI) stems from one core advantage: catching failures before they cascade into costs.

    Here’s how the ROI typically stacks up, based on real operational variables:

    1. Reduced Unplanned Downtime

    Let’s start with the cost of a midstream asset failure.

    • A compressor station failure can cost anywhere from $50,000 to $300,000 per day in lost throughput and emergency response.
    • With real-time vibration or pressure anomaly detection, sensor systems can flag degradation days before failure, enabling scheduled maintenance.

    If even one major outage is prevented per year, the sensor system often pays for itself multiple times over.

    2. Optimized Maintenance Scheduling

    Traditional maintenance is either time-based (replace parts every X months) or fail-based (fix it when it breaks). Both are inefficient.

    • Sensors enable condition-based maintenance (CBM) — replacing components when wear indicators show real need.
    • This avoids early replacement of healthy equipment and extends asset life.

    Lower maintenance labor hours, fewer replacement parts, and less downtime during maintenance windows.

    3. Fewer Compliance Violations and Penalties

    Sensor-driven monitoring improves documentation and reporting accuracy.

    • Leak detection systems, for example, can log time-stamped emissions data, critical for EPA and PHMSA audits.
    • Real-time alerts also reduce the window for unnoticed environmental releases.

    Avoidance of fines (which can exceed $100,000 per incident) and a stronger compliance posture during inspections.

    4. Lower Insurance and Risk Exposure

    Demonstrating that assets are continuously monitored and failures are mitigated proactively can:

    • Reduce risk premiums for asset insurance and liability coverage
    • Strengthen underwriting positions in facility risk models

    Lower annual risk-related costs and better positioning with insurers.

    5. Scalability Without Proportional Headcount

    Sensors and dashboards allow one centralized team to monitor hundreds of assets across vast geographies.

    • This reduces the need for site visits, on-foot inspections, and local diagnostic teams.
    • It also makes asset management scalable without linear increases in staffing costs.

    Bringing it together:

    Most midstream operators using sensor-based systems calculate ROI in 3–5 operational categories. Here’s a simplified example:

    ROI Area Annual Savings Estimate
    Prevented Downtime (1 event) $200,000
    Optimized Maintenance $70,000
    Compliance Penalty Avoidance $50,000
    Reduced Field Labor $30,000
    Total Annual Value $350,000
    System Cost (Year 1) $120,000
    First-Year ROI ~192%


    Over 3–5 years, ROI improves as systems become part of broader operational workflows, especially when data integration feeds into predictive analytics and enterprise decision-making.

    ROI isn’t hypothetical anymore. With real-time condition data, the economic case for sensor-driven monitoring becomes quantifiable, defensible, and scalable.

    Conclusion

    Sensor-driven monitoring isn’t just a nice-to-have — it’s a proven way for midstream operators to cut downtime, reduce maintenance waste, and stay ahead of failures. With the right data in hand, teams stop reacting and start optimizing.

    SCSTech helps you get there. Our digital oil and gas technology solutions are built for real-world midstream conditions — remote assets, high-pressure systems, and zero-margin-for-error operations.

    If you’re ready to make reliability measurable, SCSTech delivers the technical foundation to do it.

  • How AgTech Startups Use GIS to Optimize Irrigation and Crop Planning

    How AgTech Startups Use GIS to Optimize Irrigation and Crop Planning

    Farming isn’t uniform. In the evolving landscape of agriculture & technology, soil properties, moisture levels, and crop needs can change dramatically within meters — yet many irrigation strategies still treat fields as a single, homogenous unit.

    GIS (Geographic Information Systems) offers precise, location-based insights by layering data on soil texture, elevation, moisture, and crop growth stages. This spatial intelligence lets AgTech startups move beyond blanket irrigation to targeted water management.

    By integrating GIS with sensor data and weather models, startups can tailor irrigation schedules and volumes to the specific needs of micro-zones within a field. This approach reduces inefficiencies, helps conserve water, and supports consistent crop performance.

    Importance of GIS in Agriculture for Irrigation and Crop Planning

    Agriculture isn’t just about managing land. It’s about managing variation. Soil properties shift within a few meters. Rainfall patterns change across seasons. Crop requirements differ from one field to the next. Making decisions based on averages or intuition leads to wasted water, underperforming yields, and avoidable losses.

    GIS (Geographic Information Systems) is how AgTech startups leverage agriculture & technology innovations to turn this variability into a strategic advantage.

    GIS gives a spatial lens to data that was once trapped in spreadsheets or siloed systems. With it, agri-tech innovators can:

    • Map field-level differences in soil moisture, slope, texture, and organic content — not as general trends but as precise, geo-tagged layers.
    • Align irrigation strategies with crop needs, landform behavior, and localized weather forecasts.
    • Support real-time decision-making, where planting windows, water inputs, and fertilizer applications are all tailored to micro-zone conditions.

    To put it simply: GIS enables location-aware farming. And in irrigation or crop planning, location is everything.

    A one-size-fits-all approach may lead to 20–40% water overuse in certain regions and simultaneous under-irrigation in others. By contrast, GIS-backed systems can reduce water waste by up to 30% while improving crop yield consistency, especially in water-scarce zones.

    GIS Data Layers Used for Irrigation and Crop Decision-Making

    GIS Data Layers Powering Smarter Irrigation and Crop Planning

    The power of GIS lies in its ability to stack different data layers — each representing a unique aspect of the land — into a single, interpretable visual model. For AgTech startups focused on irrigation and crop planning, these layers are the building blocks of smarter, site-specific decisions.

    Let’s break down the most critical GIS layers used in precision agriculture:

    1. Soil Type and Texture Maps

    • Determines water retention, percolation rate, and root-zone depth
    • Clay-rich soils retain water longer, while sandy soils drain quickly
    • GIS helps segment fields into soil zones so that irrigation scheduling aligns with water-holding capacity

    Irrigation plans that ignore soil texture can lead to overwatering on heavy soils and water stress on sandy patches — both of which hurt yield and resource efficiency.

    2. Slope and Elevation Models (DEM – Digital Elevation Models)

    • Identifies water flow direction, runoff risk, and erosion-prone zones
    • Helps calculate irrigation pressure zones and place contour-based systems effectively
    • Allows startups to design variable-rate irrigation plans, minimizing water pooling or wastage in low-lying areas

    3. Soil Moisture and Temperature Data (Often IoT Sensor-Integrated)

    • Real-time or periodic mapping of subsurface moisture levels powered by artificial intelligence in agriculture
    • GIS integrates this with surface temperature maps to detect drought stress or optimal planting windows

    Combining moisture maps with evapotranspiration models allows startups to trigger irrigation only when thresholds are crossed, avoiding fixed schedules.

    4. Crop Type and Growth Stage Maps

    • Uses satellite imagery or drone-captured NDVI (Normalized Difference Vegetation Index)
    • Tracks vegetation health, chlorophyll levels, and biomass variability across zones
    • Helps match irrigation volume to crop growth phase — seedlings vs. fruiting stages have vastly different needs

    Ensures water is applied where it’s needed most, reducing waste and improving uniformity.

    5. Historical Yield and Input Application Maps

    • Maps previous harvest outcomes, fertilizer applications, and pest outbreaks
    • Allows startups to overlay these with current-year conditions to forecast input ROI

    GIS can recommend crop shifts or irrigation changes based on proven success/failure patterns across zones.

    By combining these data layers, GIS creates a 360° field intelligence system — one that doesn’t just react to soil or weather, but anticipates needs based on real-world variability.

    How GIS Helps Optimize Irrigation in Farmlands

    Optimizing irrigation isn’t about simply adding more sensors or automating pumps. It’s about understanding where, when, and how much water each zone of a farm truly needs — and GIS is the system that makes that intelligence operational.

    Here’s how AgTech startups are using GIS to drive precision irrigation in real, measurable steps:

    1. Zoning Farmlands Based on Hydrological Behavior

    Using GIS, farmlands are divided into irrigation management zones by analyzing soil texture, slope, and historical moisture retention.

    • High clay zones may need less frequent, deeper irrigation
    • Sandy zones may require shorter, more frequent cycles
    • GIS maps these zones down to a 10m x 10m (or even finer) resolution, enabling differentiated irrigation logic per zone

    Irrigation plans stop being uniform. Instead, water delivery matches the absorption and retention profile of each micro-zone.

    2. Integrating Real-Time Weather and Evapotranspiration Data

    GIS platforms integrate satellite weather feeds and localized evapotranspiration (ET) models — which calculate how much water a crop is losing daily due to heat and wind.

    • The system then compares ET rates with real-time soil moisture data
    • When depletion crosses a set threshold (say, 50% of field capacity), GIS triggers or recommends irrigation — tailored by zone

    3. Automating Variable Rate Irrigation (VRI) Execution

    AgTech startups link GIS outputs directly with VRI-enabled irrigation systems (e.g., pivot systems or drip controllers).

    • Each zone receives a customized flow rate and timing
    • GIS controls or informs nozzles and emitters to adjust water volume on the move
    • Even during a single irrigation pass, systems adjust based on mapped need levels

    4. Detecting and Correcting Irrigation Inefficiencies

    GIS helps track where irrigation is underperforming due to:

    • Blocked emitters or leaks
    • Pressure inconsistencies
    • Poor infiltration zones

    By overlaying actual soil moisture maps with intended irrigation plans, GIS identifies deviations — sometimes in near real-time.

    Alerts are sent to field teams or automated systems to adjust flow rates, fix hardware, or reconfigure irrigation maps.

    5. Enabling Predictive Irrigation Based on Crop Stage and Forecasts

    GIS tools layer crop phenology models (growth stage timelines) with weather forecasts.

    • For example, during flowering stages, water demand may spike 30–50% for many crops.
    • GIS platforms model upcoming rainfall and temperature shifts, helping plan just-in-time irrigation events before stress sets in.

    Instead of reactive watering, farmers move into data-backed anticipation — a fundamental shift in irrigation management.

    GIS transforms irrigation from a fixed routine into a dynamic, responsive system — one that reacts to both the land’s condition and what’s coming next. AgTech startups that embed GIS into their irrigation stack aren’t just conserving water; they’re building systems that scale intelligently with environmental complexity.

    Conclusion

    GIS is no longer optional in modern agriculture & technology — it’s how AgTech startups bring precision to irrigation and crop planning. From mapping soil zones to triggering irrigation based on real-time weather and crop needs, GIS turns field variability into a strategic advantage.

    But precision only works if your data flows into action. That’s where SCSTech comes in. Our GIS solutions help AgTech teams move from scattered data to clear, usable insights, powering smarter irrigation models and crop plans that adapt to real-world conditions.

  • 5 Ways Digital Twin Technology is Helping Utility Firms Predict and Prevent Failures

    5 Ways Digital Twin Technology is Helping Utility Firms Predict and Prevent Failures

    Utility companies encounter expensive equipment breakdowns that halt service and compromise safety. The greatest challenge is not repairing breakdowns, it’s predicting when they will occur.

    As part of a broader digital transformation strategy, digital twin tech produces virtual, real-time copies of physical assets, fueled by real-time sensor feeds such as temperature, vibration, and load. This dynamic model replicates asset health in real-time as it evolves.

    Utilities identify early warning signs, model stress conditions, and predict failure horizons with digital twins. Maintenance becomes a proactive intervention in response to real conditions instead of reactive repairs.

    The Digital Twin Technology Role in Failure Prediction 

    How Digital Twins work in Utility Systems

    Utility firms run on tight margins for error. A single equipment failure — whether it’s in a substation, water main, or gas line — can trigger costly downtimes, safety risks, and public backlash. The problem isn’t just failure. It’s not knowing when something is about to fail.

    Digital twin technology changes that.

    At its core, a digital twin is a virtual replica of a physical asset or system. But this isn’t just a static model. It’s a dynamic, real-time environment fed by live data from the field.

    • Sensors on physical assets capture metrics like:
      • Temperature
      • Pressure
      • Vibration levels
      • Load fluctuations
    • That data streams into the digital twin, which updates in real time and mirrors the condition of the asset as it evolves.

    This real-time reflection isn’t just about monitoring — it’s about prediction. With enough data history, utility firms can start to:

    • Detect anomalies before alarms go off
    • Simulate how an asset might respond under stress (like heatwaves or load spikes)
    • Forecast the likely time to failure based on wear patterns

    As a result, maintenance shifts from reactive to proactive. You’re no longer waiting for equipment to break or relying on calendar-based checkups. Instead:

    • Assets are serviced based on real-time health
    • Failures are anticipated — and often prevented
    • Resources are allocated based on actual risk, not guesswork

    In high-stakes systems where uptime matters, this shift isn’t just an upgrade — it’s a necessity.

    Ways Digital Twin Technology is Helping Utility Firms Predict and Prevent Failures

    1. Proactive Maintenance Through Real-Time Monitoring

    In a typical utility setup, maintenance is either time-based (like changing oil every 6 months) or event-driven (something breaks, then it gets fixed). Neither approach adapts to how the asset is actually performing.

    Digital twins allow firms to move to condition-based maintenance, using real-time data to catch failure indicators before anything breaks. This shift is a key component of any effective digital transformation strategy that utility firms implement to improve asset management.

    Take this scenario:

    • A substation transformer is fitted with sensors tracking internal oil temperature, moisture levels, and load current.
    • The digital twin uses this live stream to detect subtle trends, like a slow rise in dissolved gas levels, which often points to early insulation breakdown.
    • Based on this insight, engineers know the transformer doesn’t need immediate replacement, but it does need inspection within the next two weeks to prevent cascading failure.

    That level of specificity is what sets digital twins apart from basic SCADA systems.

    Other real-world examples include:

    • Water utilities detecting flow inconsistencies that indicate pipe leakage, before it becomes visible or floods a zone.
    • Wind turbine operators identifying torque fluctuations in gearboxes that predict mechanical fatigue.

    Here’s what this proactive monitoring unlocks:

    • Early detection of failure patterns — long before traditional alarms would trigger.
    • Targeted interventions — send teams to fix assets showing real degradation, not just based on the calendar.
    • Shorter repair windows — because issues are caught earlier and are less severe.
    • Smarter budget use — fewer emergency repairs and lower asset replacement costs.

    This isn’t just monitoring for the sake of data. It’s a way to read the early signals of failure — and act on them before the problem exists in the real world.

    2. Enhanced Vegetation Management and Risk Mitigation

    Vegetation encroachment is a leading cause of power outages and wildfire risks. Traditional inspection methods are often time-consuming and less precise. Digital twins, integrated with LiDAR and AI technologies, offer a more efficient solution. By creating detailed 3D models of utility networks and surrounding vegetation, utilities can predict growth patterns and identify high-risk areas.

    This enables utility firms to:

    • Map the exact proximity of vegetation to assets in real-time
    • Predict growth patterns based on species type, local weather, and terrain
    • Pinpoint high-risk zones before branches become threats or trigger regulatory violations

    Let’s take a real-world example:

    Southern California Edison used Neara’s digital twin platform to overhaul its vegetation management.

    • What used to take months to determine clearance guidance now takes weeks
    • Work execution was completed 50% faster, thanks to precise, data-backed targeting

    Vegetation isn’t going to stop growing. But with a digital twin watching over it, utility firms don’t have to be caught off guard.

    3. Optimized Grid Operations and Load Management

    Balancing supply and demand in real-time is crucial for grid stability. Digital twins facilitate this by simulating various operational scenarios, allowing utilities to optimize energy distribution and manage loads effectively. By analyzing data from smart meters, sensors, and other grid components, potential bottlenecks can be identified and addressed proactively.

    Here’s how it works in practice:

    • Data from smart meters, IoT sensors, and control systems is funnelled into the digital twin.
    • The platform then runs what-if scenarios:
      • What happens if demand spikes in one region?
      • What if a substation goes offline unexpectedly?
      • How do EV charging surges affect residential loads?

    These simulations allow utility firms to:

    • Balance loads dynamically — shifting supply across regions based on actual demand
    • Identify bottlenecks in the grid — before they lead to voltage drops or system trips
    • Test responses to outages or disruptions — without touching the real infrastructure

    One real-world application comes from Siemens, which uses digital twin technology to model substations across its power grid. By creating these virtual replicas, operators can:

    • Detect voltage anomalies or reactive power imbalances quickly
    • Simulate switching operations before pushing them live
    • Reduce fault response time and improve grid reliability overall

    This level of foresight turns grid management from a reactive firefighting role into a strategic, scenario-tested process.

    When energy systems are stretched thin, especially with renewables feeding intermittent loads, a digital twin becomes less of a luxury and more of a grid operator’s control room essential.

    4. Improved Emergency Response and Disaster Preparedness

    When a storm hits, a wildfire spreads, or a substation goes offline unexpectedly, every second counts. Utility firms need more than just a damage report — they need situational awareness and clear action paths.

    Digital twins give operators that clarity, before, during, and after an emergency.

    Unlike traditional models that provide static views, digital twins offer live, geospatially aware environments that evolve in real time based on field inputs. This enables faster, better-coordinated responses across teams.

    Here’s how digital twins strengthen emergency preparedness:

    • Pre-event scenario planning
      • Simulate storm surges, fire paths, or equipment failure to see how the grid will respond
      • Identify weak links in the network (e.g. aging transformers, high-risk lines) and pre-position resources accordingly
    • Real-time situational monitoring
      • Integrate drone feeds, sensor alerts, and field crew updates directly into the twin
      • Track which areas are inaccessible, where outages are expanding, and how restoration efforts are progressing
    • Faster field deployment
      • Dispatch crews with exact asset locations, hazard maps, and work orders tied to real-time conditions
      • Reduce miscommunication and avoid wasted trips during chaotic situations

    For example, during wildfires or hurricanes, digital twins can overlay evacuation zones, line outage maps, and grid stress indicators in one place — helping both operations teams and emergency planners align fast.

    When things go wrong, digital twins don’t just help respond — they help prepare, so the fallout is minimised before it even begins.

    5. Streamlined Regulatory Compliance and Reporting

    For utility firms, compliance isn’t optional, it’s a constant demand. From safety inspections to environmental impact reports, regulators expect accurate documentation, on time, every time. Gathering that data manually is often time-consuming, error-prone, and disconnected across departments.

    Digital twins simplify the entire compliance process by turning operational data into traceable, report-ready insights.

    Here’s what that looks like in practice:

    • Automated data capture
      • Sensors feed real-time operational metrics (e.g., line loads, maintenance history, vegetation clearance) into the digital twin continuously
      • No need to chase logs, cross-check spreadsheets, or manually input field data
    • Built-in audit trails
      • Every change to the system — from a voltage dip to a completed work order — is automatically timestamped and stored
      • Auditors get clear records of what happened, when, and how the utility responded
    • On-demand compliance reports
      • Whether it’s for NERC reliability standards, wildfire mitigation plans, or energy usage disclosures, reports can be generated quickly using accurate, up-to-date data
      • No scrambling before deadlines, no gaps in documentation

    For utilities operating in highly regulated environments — especially those subject to increasing scrutiny over grid safety and climate risk — this level of operational transparency is a game-changer.

    With a digital twin in place, compliance shifts from being a back-office burden to a built-in outcome of how the grid is managed every day.

    Conclusion

    Digital twin technology is revolutionizing the utility sector by enabling predictive maintenance, optimizing operations, enhancing emergency preparedness, and ensuring regulatory compliance. By adopting this technology, utility firms can improve reliability, reduce costs, and better serve their customers in an increasingly complex and demanding environment.

    At SCS Tech, we specialize in delivering comprehensive digital transformation solutions tailored to the unique needs of utility companies. Our expertise in developing and implementing digital twin strategies ensures that your organization stays ahead of the curve, embracing innovation to achieve operational excellence.

    Ready to transform your utility operations with proven digital utility solutions? Contact one of the leading digital transformation companies—SCS Tech—to explore how our tailored digital transformation strategy can help you predict and prevent failures.

  • How to Structure Tier-1 to Tier-3 Escalation Flows with Incident Software

    How to Structure Tier-1 to Tier-3 Escalation Flows with Incident Software

    When an alert hits your system, there’s a split-second decision that determines how long it lingers: Can Tier-1 handle this—or should we escalate?

    Now multiply that by hundreds of alerts a month, across teams, time zones, and shifts—and you’ve got a pattern of knee-jerk escalations, duplicated effort, and drained senior engineers stuck cleaning up tickets that shouldn’t have reached them in the first place.

    Most companies don’t lack talent—they lack escalation logic. They escalate based on panic, not process.

    Here’s how incident software can help you fix that—by structuring each tier with rules, boundaries, and built-in context, so your team knows who handles what, when, and how—without guessing.

    The Real Problem with Tiered Escalation (And It’s Not What You Think)

    Tiered Escalation
    Most escalation flows look clean—on slides. In reality? It’s a maze of sticky notes, gut decisions, and “just pass it to Tier-2” habits.

    Here’s what usually goes wrong:

    • Tier-1 holds on too long—hoping to fix it, wasting response time
    • Or escalates too soon—with barely any context
    • Tier-2 gets it, but has to re-diagnose because there’s no trace of what’s been done
    • Tier-3 ends up firefighting issues that were never filtered properly

    Why does this happen? Because escalation is treated like a transfer, not a transition. And without boundary-setting and logic, even the best software ends up becoming a digital dumping ground.

    That’s where structured escalation flows come in—not as static chains, but as decision systems. A well-designed incident management software helps implement these decision systems by aligning every tier’s scope, rules, and responsibilities. Each tier should know:

    • What they’re expected to solve
    • What criteria justifies escalation
    • What information must be attached before passing the baton

    Anything less than that—and escalation just becomes escalation theater.

    Structuring Escalation Logic: What Should Happen at Each Tier (with Boundaries)

    Escalation tiers aren’t ranks—they’re response layers with different scopes of authority, context, and tools. Here’s how to structure them so everyone acts, not just reacts.

    Tier-1: Containment and Categorization—Not Root Cause

    Tier-1 isn’t there to solve deep problems. They’re the first line of control—triaging, logging, and assigning severity. But often they’re blamed for “not solving” what they were never supposed to.

    Here’s what Tier-1 should do:

    • Acknowledge the alert within the SLA window
    • Check for known issues in a predefined knowledge base or past tickets
    • Apply initial containment steps (e.g., restart service, check logs, run diagnostics)
    • Classify and tag the incident: severity, affected system, known symptoms
    • Escalate with structured context (timestamp, steps tried, confidence level)

    Your incident management software should enforce these checkpoints—nothing escalates without it. That’s how you stop Tier-2 from becoming Tier-1 with more tools.

    Tier-2: Deep Dive, Recurrence Detection, Cross-System Insight

    This team investigates why it happened, not just what happened. They work across services, APIs, and dependencies—often comparing live and historical data.

    What should your software enable for Tier-2?

    • Access to full incident history, including diagnostic steps from Tier-1
    • Ability to cross-reference logs across services or clusters
    • Contextual linking to other open or past incidents (if this looks like déjà vu, it probably is)
    • Authority to apply temporary fixes—but flag for deeper RCA (root cause analysis) if needed

    Tier-2 should only escalate if systemic issues are detected, or if business impact requires strategic trade-offs.

    Tier-3: Permanent Fixes and Strategic Prevention

    By the time an incident reaches Tier-3, it’s no longer about restoring function—it’s about preventing it from happening again.

    They need:

    • Full access to code, configuration, and deployment pipelines
    • The authority to roll out permanent fixes (sometimes involving product or architecture changes)
    • Visibility into broader impact: Is this a one-off? A design flaw? A risk to SLAs?

    Tier-3’s involvement should trigger documentation, backlog tickets, and perhaps even blameless postmortems. Escalating to Tier-3 isn’t a failure—it’s an investment in system resilience.

    Building Escalation into Your Incident Management Software (So It’s Not Just a Ticket System)

    Most incident tools act like inboxes—they collect alerts. But to support real escalation, your software needs to behave more like a decision layer, not a passive log.

    Here’s how that looks in practice.

    1. Tier-Based Views

    When a critical alert fires, who sees it? If everyone on-call sees every ticket, it dilutes urgency. Tier-based visibility means:

    • Tier-1 sees only what’s within their response scope
    • Tier-2 gets automatically alerted when severity or affected systems cross thresholds
    • Tier-3 only gets pulled when systemic patterns emerge or human escalation occurs

    This removes alert fatigue and brings sharp clarity to ownership. No more “who’s handling this?”

    2. Escalation Triggers

    Your escalation shouldn’t rely on someone deciding when to escalate. The system should flag it:

    • If Tier-1 exceeds time to resolve
    • If the same alert repeats within X hours
    • If affected services reach a certain business threshold (e.g., customer-facing)

    These triggers can auto-create a Tier-2 task, notify SMEs, or even open an incident war room with pre-set stakeholders. Think: decision trees with automation.

    3. Context-Rich Handoffs 

    Escalation often breaks because Tier-2 or Tier-3 gets raw alerts, not narratives. Your software should automatically pull and attach:

    • Initial diagnostics
    • Steps already taken
    • System health graphs
    • Previous related incidents
    • Logs, screenshots, and even Slack threads

    This isn’t a “notes” field. It’s structured metadata that keeps context alive without relying on the person escalating.

    4. Accountability Logging

    A smooth escalation trail helps teams learn from the incident—not just survive it.

    Your incident software should:

    • Timestamp every handoff
    • Record who escalated, when, and why
    • Show what actions were taken at each tier
    • Auto-generate a timeline for RCA documentation

    This makes postmortems fast, fair, and actionable—not hours of Slack archaeology.

    When escalation logic is embedded, not documented, incident response becomes faster and repeatable—even under pressure.

    Common Pitfalls in Building Escalation Structures (And How to Avoid Them)

    While creating a smooth escalation flow sounds simple, there are a few common traps teams fall into when setting up incident management systems. Avoiding these pitfalls ensures your escalation flows work as they should when the pressure is on.

    1. Overcomplicating Escalation Triggers

    Adding too many layers or overly complex conditions for when an escalation should happen can slow down response times. Overcomplicating escalation rules can lead to delays and miscommunication.

    Keep escalation triggers simple but actionable. Aim for a few critical conditions that must be met before escalating to the next tier. This keeps teams focused on responding, not searching through layers of complexity. For example:

    • If a high-severity incident hasn’t been addressed in 15 minutes, auto-escalate.
    • If a service has reached 80% of capacity for over 5 minutes, escalate to Tier-2.

    2. Lack of Clear Ownership at Each Tier

    When there’s uncertainty about who owns a ticket, or ownership isn’t transferred clearly between teams, things slip through the cracks. This creates chaos and miscommunication when escalation happens.

    Be clear on ownership at each level. Your incident software should make this explicit. Tier-1 should know exactly what they’re accountable for, Tier-2 should know the moment a critical incident is escalated, and Tier-3 should immediately see the complete context for action.

    Set default owners for every tier, with auto-assignment based on workload. This eliminates ambiguity during time-sensitive situations.

    3. Underestimating the Importance of Context

    Escalations often fail because they happen without context. Passing a vague or incomplete incident to the next team creates bottlenecks.

    Ensure context-rich handoffs with every escalation. As mentioned earlier, integrate tools for pulling in logs, diagnostics, service health, and team notes. The team at the next tier should be able to understand the incident as if they’ve been working on it from the start. This also enables smoother collaboration when escalation happens.

    4. Ignoring the Post-Incident Learning Loop

    Once the incident is resolved, many teams close the issue and move on, forgetting to analyze what went wrong and what can be improved in the future.

    Incorporate a feedback loop into your escalation process. Your incident management software should allow teams to mark incidents as “postmortem required” with a direct link to learning resources. Encourage root-cause analysis (RCA) after every major incident, with automated templates to capture key findings from each escalation level.

    By analyzing the incident flow, you’ll uncover bottlenecks or gaps in your escalation structure and refine it over time.

    5. Failing to Test the Escalation Flow

    Thinking the system will work perfectly the first time is a mistake. Incident software can fail when escalations aren’t tested under realistic conditions, leading to inefficiencies during actual events.

    Test your escalation flows regularly. Simulate incidents with different severity levels to see how your system handles real-time escalations. Bring in Tier-1, Tier-2, and Tier-3 teams to practice. Conduct fire drills to identify weak spots in your escalation logic and ensure everyone knows their responsibilities under pressure.

    Wrapping Up

    Effective escalation flows aren’t just about ticket management—they are a strategy for ensuring that your team can respond to critical incidents swiftly and intelligently. By avoiding common pitfalls, maintaining clear ownership, integrating automation, and testing your system regularly, you can build an escalation flow that’s ready to handle any challenge, no matter how urgent. 

    At SCS Tech, we specialize in crafting tailored escalation strategies that help businesses maintain control and efficiency during high-pressure situations. Ready to streamline your escalation process and ensure faster resolutions? Contact SCS Tech today to learn how we can optimize your systems for stability and success.

  • Why AI/ML Models Are Failing in Business Forecasting—And How to Fix It

    Why AI/ML Models Are Failing in Business Forecasting—And How to Fix It

    You’re planning the next quarter. Your marketing spend is mapped. Hiring discussions are underway. You’re in talks with vendors for inventory.

    Every one of these moves depends on a forecast. Whether it’s revenue, demand, or churn—the numbers you trust are shaping how your business behaves.

    And in many organizations today, those forecasts are being generated—or influenced—by artificial intelligence and machine learning models.

    But here’s the reality most teams uncover too late: 80% of AI-based forecasting projects stall before they deliver meaningful value. The models look sophisticated. They generate charts, confidence intervals, and performance scores. But when tested in the real world—they fall short.

    And when they fail, you’re not just facing technical errors. You’re working with broken assumptions—leading to misaligned budgets, inaccurate demand planning, delayed pivots, and campaigns that miss their moment.

    In this article, we’ll walk you through why most AI/ML forecasting models underdeliver, what mistakes are being made under the hood, and how SCS Tech helps businesses fix this with practical, grounded AI strategies.

    Reasons AI/ML Forecasting Models Fail in Business Environments

    Let’s start where most vendors won’t—with the reasons these models go wrong. It’s not technology. It’s the foundation, the framing, and the way they’re deployed.

    1. Bad Data = Bad Predictions

    Most businesses don’t have AI problems. They have data hygiene problems.

    If your training data is outdated, inconsistent, or missing key variables, no model—no matter how complex—can produce reliable forecasts.

    Look out for these reasons: 

    • Mixing structured and unstructured data without normalization
    • Historical records that are biased, incomplete, or stored in silos
    • Using marketing or sales data that hasn’t been cleaned for seasonality or anomalies

    The result? Your AI isn’t predicting the future. It’s just amplifying your past mistakes.

    2. No Domain Intelligence in the Loop

    A model trained in isolation—without inputs from someone who knows the business context—won’t perform. It might technically be accurate, but operationally useless.

    If your forecast doesn’t consider how regulatory shifts affect your cash flow, or how a supplier issue impacts inventory, it’s just an academic model—not a business tool.

    At SCS Tech, we often inherit models built by external data teams. What’s usually missing? Someone who understands both the business cycle and how AI/ML models work. That bridge is what makes predictions usable.

    3. Overfitting on History, Underreacting to Reality

    Many forecasting engines over-rely on historical data. They assume what happened last year will happen again.

    But real markets are fluid:

    • Consumer behavior shifts post-crisis
    • Policy changes overnight
    • One viral campaign can change your sales trajectory in weeks
    • AI trained only on the past becomes blind to disruption.

    A healthy forecasting model should weigh historical trends alongside real-time indicators—like sales velocity, support tickets, sentiment data, macroeconomic signals, and more.

    4. Black Box Models Break Trust

    If your leadership can’t understand how a forecast was generated, they won’t trust it—no matter how accurate it is.

    Explainability isn’t optional. Especially in finance, operations, or healthcare—where decisions have regulatory or high-cost implications—“the model said so” is not a strategy.

    SCS Tech builds AI/ML services with transparent forecasting logic. You should be able to trace the input factors, know what weighted the prediction, and adjust based on what’s changing in your business.

    5. The Model Works—But No One Uses It

    Even technically sound models can fail because they’re not embedded into the way people work.

    If the forecast lives in a dashboard that no one checks before a pricing decision or reorder call, it’s dead weight.

    True forecasting solutions must:

    • Plug into your systems (CRM, ERP, inventory planning tools)
    • Push recommendations at the right time—not just pull reports
    • Allow for human overrides and inputs—because real-world intuition still matters

    How to Improve AI/ML Forecasting Accuracy in Real Business Conditions

    Let’s shift from diagnosis to solution. Based on our experience building, fixing, and operationalizing AI/ML forecasting for real businesses, here’s what actually works.


    How to Improve AI/ML Forecasting Accuracy

    Focus on Clean, Connected Data First

    Before training a model, get your data streams in order. Standardize formats. Fill the gaps. Identify the outliers. Merge your CRM, ERP, and demand data.

    You don’t need “big” data. You need usable data.

    Pair Data Science with Business Knowledge

    We’ve seen the difference it makes when forecasting teams work side by side with sales heads, finance leads, and ops managers.

    It’s not about guessing what metrics matter. It’s about modeling what actually drives margin, retention, or burn rate—because the people closest to the numbers shape better logic.

    Mix Real-Time Signals with Historical Trends

    Seasonality is useful—but only when paired with present conditions.

    Good forecasting blends:

    • Historical performance
    • Current customer behavior
    • Supply chain signals
    • Marketing campaign performance
    • External economic triggers

    This is how SCS Tech builds forecasting engines—as dynamic systems, not static reports.

    Design for Interpretability

    It’s not just about accuracy. It’s about trust.

    A business leader should be able to look at a forecast and understand:

    • What changed since last quarter
    • Why the forecast shifted
    • Which levers (price, channel, region) are influencing results

    Transparency builds adoption. And adoption builds ROI.

    Embed the Forecast Into the Flow of Work

    If the prediction doesn’t reach the person making the decision—fast—it’s wasted.

    Forecasts should show up inside:

    • Reordering systems
    • Revenue planning dashboards
    • Marketing spend allocation tools

    Don’t ask users to visit your model. Bring the model to where they make decisions.

    How SCS Tech Builds Reliable, Business-Ready AI/ML Forecasting Solutions

    SCS Tech doesn’t sell AI dashboards. We build decision systems. That means:

    • Clean data pipelines
    • Models trained with domain logic
    • Forecasts that update in real time
    • Interfaces that let your people use them—without guessing

    You don’t need a data science team to make this work. You need a partner who understands your operation—and who’s done this before. That’s us.

    Final Thoughts

    If your forecasts feel disconnected from your actual outcomes, you’re not alone. The truth is, most AI/ML models fail in business contexts because they weren’t built for them in the first place.

    You don’t need more complexity. You need clarity, usability, and integration.

    And if you’re ready to rethink how forecasting actually supports business growth, we’re ready to help. Talk to SCS Tech. Let’s start with one recurring decision in your business. We’ll show you how to turn it from a guess into a prediction you can trust.

    FAQs

    1. Can we use AI/ML forecasting without completely changing our current tools or tech stack?

    Absolutely. We never recommend tearing down what’s already working. Our models are designed to integrate with your existing systems—whether it’s ERP, CRM, or custom dashboards.

    We focus on embedding forecasting into your workflow, not creating a separate one. That’s what keeps adoption high and disruption low.

    1. How do I explain the value of AI/ML forecasting to my leadership or board?

    You explain it in terms they care about: risk reduction, speed of decision-making, and resource efficiency.

    Instead of making decisions based on assumptions or outdated reports, forecasting systems give your team early signals to act smarter:

    • Shift budgets before a drop in conversion
    • Adjust production before an oversupply
    • Flag customer churn before it hits revenue

    We help you build a business case backed by numbers, so leadership sees AI not as a cost center, but as a decision accelerator.

    1. How long does it take before we start seeing results from a new forecasting system?

    It depends on your use case and data readiness. But in most client scenarios, we’ve delivered meaningful improvements in decision-making within the first 6–10 weeks.

    We typically begin with one focused use case—like sales forecasting or procurement planning—and show early wins. Once the model proves its value, scaling across departments becomes faster and more strategic.

  • How AI/ML Services and AIOps Are Making IT Operations Smarter and Faster?

    How AI/ML Services and AIOps Are Making IT Operations Smarter and Faster?

    Are you seeking to speed up and make IT operations smarter? With infrastructure becoming increasingly complex and workloads dynamic, traditional approaches are insufficient. IT operations are vital to business continuity, and to address today’s requirements, organizations are adopting AI/ML services and AIOps (Artificial Intelligence for IT Operations).

    These technologies make work autonomous and efficient, changing how systems are monitored and controlled. Gartner says 20% of companies will leverage AI to automate operations—removing more than half of middle management positions by 2026.

    In this blog, let’s see how AI/ML services and AIOps are making organizations really work smarter, faster, and proactively.

    How Are AI/ML Services and AIOps Making IT Operations Faster?

    1. Automating Repetitive IT Tasks

    AI/ML services apply models to transform operations into intelligent and quicker ones by identifying patterns and taking actions automatically—without human intervention. This eliminates IT teams’ need to manually read logs, answer alerts, or perform repetitive diagnostics.

    Through this, log parsing, alert verification, and restart of services that previously used hours can be achieved in an instant using AIOps platforms, vastly enhancing response time and efficiency. The key areas of automation include the following:

    A. Log Analysis

    Each layer of IT infrastructure, from hardware to applications, generates high-volume, high-velocity log data with performance metrics, error messages, system events, and usage trends.

    AI-driven log analysis engines use machine learning algorithms to consume this real-time data stream and analyze it against pre-trained models. These models can detect known patterns and abnormalities, do semantic clustering, and correlate behaviour deviations with historical baselines. The platform then exposes operational insights or passes incidents when deviations hit risk thresholds. This eliminates the need for human-driven parsing and cuts the diagnostic cycle time to a great extent.

    B. Alert Correlation

    Distributed environments have multiple systems that generate isolated alerts based on local thresholds or fault detection mechanisms. Without correlation, these alerts look unrelated and cannot be understood in their overall impact.

    AIOps solutions apply unsupervised learning methods and time-series correlation algorithms to group these alerts into coherent incident chains. The platform links lower-level events to high-level failures through temporal alignment, causal relationships, and dependency models, achieving an aggregated view of the incident. This makes the alerts much more relevant and speeds up incident triage.

    C. Self-Healing Capabilities

    After anomalies are identified or correlations are made, AIOps platforms can initiate pre-defined remediation workflows through orchestration engines. These self-healing processes are set up to run based on conditional logic and impact assessment.

    The system initially confirms whether the problem satisfies resolution conditions (e.g., severity level, impacted nodes, length) and subsequently engages in recovery procedures like service restarting, resource redimensioning, cache clearing, or reverting to baseline configuration. Everything gets logged, audited, and reported, so automated flows are being tweaked.

    2. Predictive Analytics for Proactive IT Management

    AI/ML services optimize operations to make them faster and smarter by employing historical data to develop predictive models that anticipate problems such as system downtime or resource deficiency well ahead of time. This enables IT teams to act early, minimizing downtime, enhancing uptime SLAs, and preventing delays usually experienced during live troubleshooting. These predictive functionalities include the following:

    A. Early Failure Detection

    Predictive models in AIOps platforms employ supervised learning algorithms trained on past incident history, performance logs, telemetry, and infrastructure behaviour. Predictive models analyze real-time telemetry streams against past trends to identify early-warning signals like performance degradation, unusual resource utilization, or infrastructure stress indicators.

    Critical indicators—like increasing response times, growing CPU/memory consumption, or varying network throughput—are possible leading failure indicators. The system then ranks these threats and can suggest interventions or schedule automatic preventive maintenance.

    B. Capacity Forecasting

    AI/ML services examine long-term usage trends, load variations, and business seasonality to create predictive models for infrastructure demand. With regression analysis and reinforcement learning, AIOps can simulate resource consumption across different situations, such as scheduled deployments, business incidents, or external dependencies.

    This enables the system to predict when compute, storage, or bandwidth demands exceed capacity. Such predictions feed into automated scaling policies, procurement planning, and workload balancing strategies to ensure infrastructure is cost-effective and performance-ready.

    3. Real-Time Anomaly Detection and Root Cause Analysis (RCA)

    AI/ML services render operations more intelligent by learning to recognize normal system behaviour over time and detect anomalies that could point to problems, even if they do not exceed fixed limits. They also render operations quicker by connecting data from metrics, logs, and traces immediately to identify the root cause of problems, lessening the requirement for time-consuming manual investigations.


     real-time anomaly detection and root cause analysis (RCA) using AI/ML

    The functional layers include the following:

    A. Anomaly Detection

    Machine learning models—particularly those based on unsupervised learning and clustering—are employed to identify deviations from established system baselines. These baselines are dynamic, continuously updated by the AI engine, and account for time-of-day behaviour, seasonal usage, workload patterns, and system context.

    The detection mechanism isolates anomalies based on deviation scores and statistical significance instead of fixed rule sets. This allows the system to detect insidious, non-apparent anomalies that can go unnoticed under threshold-based monitoring systems. The platform also prioritizes anomalies regarding severity, system impact, and relevance to historical incidents.

    B. Root Cause Analysis (RCA)

    RCA engines in AIOps platforms integrate logs, system traces, configuration states, and real-time metrics into a single data model. With the help of dependency graphs and causal inference algorithms, the platform determines the propagation path of the problem, tracing upstream and downstream effects across system components.

    Temporal analysis methods follow the incident back to its initial cause point. The system delivers an evidence-based causal chain with confidence levels, allowing IT teams to confirm the root cause with minimal investigation.

    4. Facilitating Real-Time Collaboration and Decision-Making

    AI/ML services and AIOps platforms enhance decision-making by providing a standard view of system data through shared dashboards, with insights specific to each team’s role. This gives every stakeholder timely access to pertinent information, resulting in faster coordination, better communication, and more effective incident resolution. These collaboration frameworks include the following:

    A. Unified Dashboards

    AIOps platforms consolidate IT-domain metrics, alerts, logs, and operation statuses into centralized dashboards. These dashboards are constructed with modular widgets that provide real-time data feeds, historical trend overlays, and visual correlation layers.

    The standard perspective removes data silos, enables quicker situational awareness, and allows for synchronized response by developers, system admins, and business users. Dashboards are interactive and allow deep drill-downs and scenario simulation while managing incidents.

    B. Contextual Role-Based Intelligence

    Role-based views are created by dividing operational data along with teams’ responsibilities. Runtime execution data, code-level exception reporting, and trace spans are provided to developers.

    Infrastructure engineers view real-time system performance statistics, capacity notifications, and network flow information. Business units can receive high-level SLA visibility or service availability statistics. This level of granularity is achieved to allow for quicker decisions by those most capable of taking the necessary action based on the information at hand.

    5. Finance Optimization and Resource Efficiency

    With AI/ML services, they conduct real-time and historical usage analyses of the infrastructure to suggest cost-saving resource deployment methods. With automation, scaling, budgeting, and resource tuning activities are carried out instantly, eliminating manual calculations or pending approvals and achieving smoother and more efficient operations.

    The optimization techniques include the following:

    A. Cloud Cost Governance

    AIOps platforms track usage metrics from cloud providers, comparing real-time and forecasted usage. Such information is cross-mapped to contractual cost models, billing thresholds, and service-level agreements.

    The system uses predictive modeling to decide when to scale up or down according to expected demand and flags underutilized resources for decommissioning. It also supports non-production scheduling and cost anomaly alerts—allowing the finance and DevOps teams to agree on operational budgets and savings goals.

    B. Labor Efficiency Gains

    By automating issue identification, triage, and remediation, AIOps dramatically lessen the number of manual processes that skilled IT professionals would otherwise handle. This speeds up time to resolution and frees up human capital for higher-level projects such as architecture design, performance engineering, or cybersecurity augmentation.

    Conclusion

    Adopting AI/ML services and AIOps is a significant leap toward enhancing IT operations. These technologies enable companies to transition from reactive, manual work to faster, more innovative, and real-time adaptive systems.

    This transition is no longer a choice—it’s required for improved performance and sustainable growth. SCS Tech facilitates this transition by providing custom AI/ML services and AIOps solutions that optimize IT operations to be more efficient, predictable, and anticipatory. Getting the right tools today can equip organizations to be ready, decrease downtime, and operate their systems with increased confidence and mastery.

  • What IT Infrastructure Solutions Do Businesses Need to Support Edge Computing Expansion?

    What IT Infrastructure Solutions Do Businesses Need to Support Edge Computing Expansion?

    Did you know that by 2025, global data volumes are expected to reach an astonishing 175 zettabytes? This will create huge challenges for businesses trying to manage the growing amount of data. So how do businesses manage such vast amounts of data instantly without relying entirely on cloud servers?

    What happens when your data grows faster than your IT infrastructure can handle? As businesses generate more data than ever before, the pressure to process, analyze, and act on that data in real time continues to rise. Traditional cloud setups can’t always keep pace, especially when speed, low latency, and instant insights are critical to business success.

    That’s where edge computing addresses such limitations. By bringing computation closer to where data is generated, it eliminates delays, reduces bandwidth use, and enhances security.

    Therefore, with local processing, and reducing reliance on cloud infrastructure, organizations are allowed to make faster decisions, improve efficiency, and stay competitive in an increasingly data-driven world.

    Read further to understand why edge computing matters and how IT infrastructure solutions help support the same.

    Why do Business Organizations need Edge Computing?

    Regarding business benefits, edge computing is a strategic benefit, not merely a technical upgrade. While edge computing allows organizations to attain better operational efficiencies through reduced latency and improve real-time decision-making to deliver continuous, seamless experiences for customers, mission-critical applications involve processing data on time to enhance reliability and safety – financial services, smart cities.

    As the Internet of Things expands its reach, scaling and decentralized infrastructure solutions become necessary for competing in an aggressively data-driven and rapidly evolving new world. Edge computing has many savings, enabling any company to stretch resources to great lengths and scale costs across operations and edge computing services into a new reality.

    What Types of IT Infrastructure Solutions Does Your Business Need?

    1. Edge Hardware

    Hardware is the core of any IT infrastructure solutions. For a business to benefit from the advantages of edge computing, the following are needed:

    Edge Servers & Gateways

    Edge servers compute the data at the location, thus avoiding communication back and forth between the centralized data centers. Gateways act as an interface middle layer aggregating and filtering IoT device data before forwarding it to the cloud or edge servers.

    IoT Devices & Sensors

    These are the primary data collectors in an edge computing architecture. Cameras, motion sensors, and environmental monitors collect and process data at the edge to support real-time analytics and instant response.

    Networking Equipment

    A network infrastructure is very important for a seamless communication system. High-speed routers and switches enable fast data transfer between the edge devices and cloud or on-premise servers.

    2. Edge Software

    The core requirement to make data processing effective is that a business must install edge computing feature-supporting software.

    Edge Management Platforms

    Controlling various edge nodes spread over different locations becomes quite complex. Platforms such as Digi Remote Manager enable the remote configuration, deployment, and monitoring of edge devices.

    Lightweight Operating Systems

    Standard OSs consume many resources. Businesses must install OS solutions designed especially for edge devices to utilize available resources effectively.

    Data Processing & Analytics Tools

    Real-time decision-making is imperative at the edge. AI-driven tools allow immediate analysis of data coming in and reduce reliance on cloud processing to enhance operational efficiency.

    Security Software

    Data on the edge is highly susceptible to cyber threats. Security measures like firewalls, encryption, and intrusion detection keep the edge computing environment safe.

    3. Cloud Integration

    While edge computing advises processing near data sources, it does not do away with cloud dependency for extensive storage and analytical functions.

    Hybrid Cloud Deployment

    Business enterprises must accept hybrid clouds, combining seamless integration with the edge and the cloud platform. Services in AWS, Azure, and Google Cloud enable proper data synchronization that an option for a central control panel can replicate.

    Edge-to-Cloud Connection

    Reliable and safe communication between edge devices and cloud data centres is fundamental. 5G, fiber-optic networking, and software-defined networking offer low-latency networking.

    4. Network Infrastructure

    Edge computing involves a robust network delivering low-latency, high-speed data transfer.

    Low Latency Networks

    The technologies, including 5G, provide for lower latency real-time communication. Those organizations that depend on edge computing will require high-speed networking solutions optimized for all their operations. SD-WAN stands for Software-Defined Wide Area Network.

    SD-WAN optimizes the network performance while ensuring data routes remain efficient and secure, even in highly distributed edge environments.

    5. Security Solutions

    Security is one of the biggest concerns with edge computing, as distributed data processing introduces more potential attack points.

    Identity & Access Management (IAM)

    The IAM solutions ensure that only authorized personnel access sensitive edge data. MFA and role-based access controls can be used to reduce security risks.

    Threat Detection & Prevention

    Businesses must deploy real-time intrusion detection and endpoint security at the edge. Cisco Edge Computing Solutions advocates trust-based security models to prevent cyberattacks and unauthorized access.

    6. Services & Support

    Deploying and managing edge infrastructure requires ongoing support and expertise.

    Consulting Services

    Businesses should seek guidance from edge computing experts to design customized solutions that align with industry needs.

    Managed Services

    Managed services for businesses lacking in-house expertise provide end-to-end support for edge computing deployments.

    Training & Support

    Ensuring IT teams understand edge management, security protocols, and troubleshooting is crucial for operational success.

    What Types of IT Infrastructure Solutions Does Your Business Need?

    Conclusion

    As businesses embrace edge computing, they must invest in scalable, secure, and efficient IT infrastructure solutions. The right combination of hardware, software, cloud integration, and security solutions ensures organizations can leverage edge computing benefits for operational efficiency and business growth.

    With infrastructure investment aligned to meet business needs, companies will come out with the best of opportunities in a very competitive, evolving digital landscape. That’s where SCS Tech comes in as an IT infrastructure solution provider, helping businesses with cutting-edge solutions that seamlessly integrate edge computing into their operations. This ensures they stay ahead in the future of computing—right at the edge.

  • How Robotic Process Automation Services Achieve Hyperautomation?

    How Robotic Process Automation Services Achieve Hyperautomation?

    Do you know that the global hyper-automation market is growing at a 12.5% CAGR? The change is fast and represents a transformational period wherein enterprises can no longer settle for automating single tasks. They need to optimize entire workflows for superior efficiency.

    But how does a company move from task automation to full-scale hyperautomation? It all starts with Robotic Process Automation services in india (RPA), the foundational technology that allows organizations to scale beyond the automation of simple tasks and into intelligent, end-to-end workflow optimization.

    Continue reading to see how robotic process automation services in india services powers hyperautomation for businesses, automating workflows to improve speed, accuracy, and digital transformation.

    What is Hyperautomation?

    Hyperautomation, more than just the automation of repetitive tasks, is reaching for an interconnected automation ecosystem that makes processes, data, and decisions flow smoothly. It’s the strategic approach for enterprises to quickly identify, vet, and automate as many business and IT processes as possible and to extend traditional automation to create an impact across the entire organization. RPA, at its core, represents this revolution, which can automate structured rule-based tasks at speed, consistency, and precision.

    However, pure hyper-automation extends beyond RPA and integrates with more technologies like AI, ML, process mining, and intelligent document processing that incorporate to get the entire workflow automated. These technologies enhance decision-making ability, eliminate inefficiencies, and optimize workflows across the enterprise.

    What is the Role of RPA in Hyperautomation?

    1. RPA as the “Hands” of Hyperautomation

    RPA shines with the automation of structured and rule-based work as the execution engine of hyper-automation. RPA bots can execute pre-defined workflows and interact with different systems to perform repetitive duties. For example, during invoice processing, RPA bots can extract data from PDFs and automatically update accounting software, which can be efficient and accurate.

    1. RPA as a Bridge for Legacy Systems

    Many organizations have problems integrating with old infrastructure. RPA solves the problem by simulating human interaction with legacy systems that do not have APIs. This way, automation can work with these systems by simulating user actions. For instance, a bank may use RPA bots to move data from a mainframe to a new reporting tool without needing expensive and complicated API integrations.

    1. RPA for Data Aggregation and Consolidation

    RPA helps automatically collect and aggregate business data. With the support of RPA, businesses can gain a better single view through a consolidated fragmented source of data. For instance, RPA-based sales data collected from different e-commerce channels can provide a performance overview.

    How Does RPA Interact with Other Technologies to Make Hyperautomation?

    1. AI-Based RPA: Increasing the Smartness

    RPA becomes intelligent by associating with other AI-based technologies.

    • Natural Language Processing (NLP): This facilitates using unstructured emails and chat logs to enable the intelligent routing of communications
    • Machine Learning (ML): These bots increase their performance over time because of the data they draw from the previous records. Hence, it maximizes accuracy and efficiency.
    • Computer Vision: This is an advancement of RPA since it enables one to interface with applications that may or may not contain structured interfaces with no screen present.

    For instance, AI-based RPA can be used in intelligent claims processing in insurance, where it can automatically extract, validate, and route data.

    1. Process Mining for Identifying Automation Opportunities

    Process mining tools assess the workflow and then identify the points of inefficiency by pointing to where automating is likely. The bottleneck found can be automated using RPA, streamlining the processes involved. An example would be if a hospital optimized admission using process mining to automate entry and verification through RPA.

    1. iBPMS for Orchestration

    iBPMS provides governance and real-time automation monitoring; therefore, it executes processes efficiently and effectively. RPA automates some tasks within an extensive process framework managed by iBPMS. For example, order fulfillment in e-commerce involves using RPA to update inventory and ship orders.

    1. Low-Code/No-Code Automation for Business Users

    Low-code/no-code platforms enable nontechnical employees to develop RPA workflows, thus democratizing automation and speeding up hyper-automation adoption. For example, a marketing team can use a low-code tool to automate lead management, freeing time for more strategic activities while improving efficiency.

    RPA's Interaction with Other Technologies to Make Hyperautomation

    What is the Impact Of RPA on Hyperautomation in Terms of Business?

    1. Unleash Full Potential

    Hyperautomation unlocks the true potential of RPA, which is rich in AI, process mining, and intelligent decision-making. The RPA performs mundane tasks, while AI-driven tools optimize workflows and improve decision-making and accuracy.

    For example, RPA bots can process invoice data extraction. AI enhances document classification and validation to ensure everything is automated.

    1. Flexibility and Agility in Operations

    RPA enables businesses to integrate multiple automation tools under one umbrella while still being able to change immediately according to fluctuating market and business situations. This cannot be achieved through static automation, but it provides more scalable and flexible ways of automating workflows with real-time optimization using RPA-based hyperautomation.

    1. Increasing Workforce Productivity

    With the automation of mundane, time-consuming tasks, RPA allows others to apply more of their expertise in strategic thinking, innovation, and customer interaction, thereby improving workforce productivity and further driving the business.

    1. Seamless Interoperability Of Systems

    RPA makes the data exchange and execution of workflows between business units, digital workers or bots, and IT systems invisible. This gives organizations the benefit of faster decisions and effective operations.

    Hyperautomation using RPA provides for efficiency, reduced operational cost, and ROI. Therefore, business benefits range from real-time data processing to automatic compliance checks with easy scalability to stay sustainable and profitable over long periods.

    Conclusion

    Hyperautomation is more than just RPA services—it’s about integrating technologies like AI, process mining, and low-code platforms to drive real transformation.

    Hyperautomation is not just about adding technology to your processes — it’s about rethinking how work flows across your organization. By combining technology intelligently, businesses can automate smarter, work faster, and make decisions with greater accuracy.]

    This powerful digital strategy, driven by RPA services, can not only boost efficiency but also help your organization become more agile, resilient, and future-ready.

    As a leader in the automation solutions firm, SCS Tech supports initiating this digital strategy in organizations to help them move beyond tactical automation to a strategic enabler of that same transformation.

  • How Do Blockchain-Powered eGovernance Solutions Improve Public Service Delivery?

    How Do Blockchain-Powered eGovernance Solutions Improve Public Service Delivery?

    Do you hope for governments to be able to deliver faster, more transparent, and more efficient services in this digital world? Blockchain-powered eGovernance solutions are likely to help with this and become the foundational technology for 30% of the world’s customer base, from simple, everyday devices to commercial activities, by 2030. It will signal a fundamental shift in how public service delivery takes place and make governance smarter, safer, and more accessible.

    In this blog, we’ll explore how blockchain-powered eGovernance solutions improve public services. These advancements are reshaping how governments serve their citizens, from automating workflows to enhancing transparency.

    1. Decentralization: Building Resilient Systems

    Distributed Systems for Reliable Services

    Traditional systems are primarily based on centralized databases, prone to cyberattacks, downtime, and data breaches. With the power of Distributed Ledger Technology (DLT), blockchain changes this by distributing data across multiple nodes. This decentralization ensures that the system functions seamlessly if one part of the network fails. Governments can enhance service reliability and eliminate the risks associated with single points of failure.

    Faster and More Efficient Processes

    Centralized systems can create a bottleneck because they function off one control point. Blockchain removes the bottleneck because multiple departments can access and share real-time information. For example, processing permits or verifying applications becomes quicker if multiple agencies can update and access the record simultaneously. Such gives citizens less waiting time in government offices and more efficiency in their governments.

    2. Effectiveness Through Smart Contracts

    Automation Made Easy

    Imagine filing a tax return and processing the refund instantly without human intervention. Blockchain makes this possible through smart contracts—self-executing agreements coded to perform actions when certain conditions are met. These contracts automate fund disbursements, application approvals, or service verifications, significantly reducing delays and manual errors.

    Streamlining Government Workflows

    Governments would handle repetitive jobs, such as checking documents or issuing licenses. Through the rule and procedure codification in a smart contract, these jobs are automated, reducing errors and making them consistent. This saves time and allows employees to focus on more important things, increasing productivity and citizen satisfaction.

    3. Transparency: The Basis of Trust

    Open Access to Transactions

    Blockchain records every transaction on a public ledger accessible to all stakeholders. Citizens can see how public funds are allocated, ensuring accountability. For example, in infrastructure projects, blockchain can show how funds are spent at each stage, reducing doubts and fostering trust in government actions.

    Immutable Records for Audits

    This ensures that once recorded, data is immutable, hence unchangeable unless the network has agreed to its alteration. It makes auditing very simple and tamper-proof. The governments will be able to maintain records that are easy to verify but hard to alter, reducing further corruption and assuring ethical administration.

    4. Building Citizen Trust

    Reliable and Transparent Systems

    Blockchain’s design inherently fosters trust. Citizens know their data is secure, and their interactions with government entities are recorded transparently and immutable. For example, once a land ownership record is stored on the blockchain, it cannot be changed without alerting the entire network, ensuring property rights remain secure.

    Empowering Citizens through Accountability

    For example, transparency in the governance process allows citizens to hold officials responsible. If funds allocated to education or health are visible in a blockchain, citizens can check the discrepancies in the ledger and thus strengthen their trust in such public institutions; at the same time, these institutions will forge a collaborative relationship with citizens.

    5. Secure Digital Identities

    Self-Sovereign Identity for Privacy

    Blockchain facilitates self-sovereign identity (SSI). It gives individuals complete control of their personal information. Unlike systems that store secret information in centralized databases, blockchain stores information in blockchains. It puts citizens in the best position to decide who shall access their data and for what purpose. There is a reduced likelihood of identity theft, and personal privacy is amplified.

    Simplification of Accessibility to Services

    Using blockchain-powered eGovernance solutions, citizens will have secure digital IDs that facilitate verification faster. Rather than sending the same set of documents repeatedly for various services from the government, they will use a blockchain-based ID to check their eligibility on the go. This would reduce the access time to public services and enhance the convenience level with data safety.

    6. Cost Saving: A Wise Use of Resources

    Reducing Administrative Costs

    This kind of paper trail and manual procedure costs governments massive amounts. With blockchain, such paper trails do not exist. Records are digitalized, and workflows are automated. For example, property registration or certificate issuing on blockchain automatically reduces administrative overhead.

    Fraud Prevention and Elimination of Mistakes

    Fraudulent actions and human mistakes can be costly for governments. Blockchain’s openness and immutable ledger reduce these risks because it leaves a transparent and tamper-proof history of the transactions. Not only does it save money in investigations, but it also ensures accurate delivery of services with no rework or additional costs incurred.

    7. Improved Data Security

    Encryption for Stronger Safeguards

    Blockchain uses advanced cryptographic techniques to secure data. Each block is linked to the one before it, creating a nearly impossible chain to alter without detection. Sensitive information, such as health records or tax data, is protected from unauthorized access, ensuring citizen data remains secure.

    Defense Against Cyberattacks

    In traditional systems, hackers will always target centralized databases. With blockchain, data is spread across different nodes, meaning that cybercriminals will find it much more challenging to access large volumes of information or manipulate the same. Therefore, public services will remain accessible and trustworthy, even in cyber attacks.

    Conclusion

    It’s not just an upgrade in technology but rather the need for governance in modern society. Blockchain can solve all inefficiencies presented by traditional public administrations by decentralizing systems, automating workflows, facilitating transparent processes, and improving cost efficiency. The improvement in this technology develops citizens’ participation, engenders trust, and makes governance in a fast-to-be-digitized world robust.

    Companies like SCS Tech are leading the way by offering innovative blockchain-powered eGovernance solutions that help governments modernize their systems effectively. As governments worldwide continue exploring blockchain, the positive effects will stretch beyond improving service delivery. They will ensure they have developed transparent, efficient, and secure governance structures, hence meeting the demands of tech-savvy citizens today.