Tag: #digitaltransformation

  • Ultimate Guide to Cloud Adoption for Indian Enterprises (Benefits, Challenges, and Best Practices)

    Ultimate Guide to Cloud Adoption for Indian Enterprises (Benefits, Challenges, and Best Practices)

    Cloud adoption is no longer an IT project — it’s a business imperative. Indian enterprises are migrating workloads, modernizing applications, and building cloud-native platforms to unlock agility, lower time-to-market, and support new AI and data initiatives. But while cloud adoption promises substantial value, it also introduces new operational, security, and cost-management challenges. This guide explains the benefits, lays out the common obstacles Indian enterprises face, and provides pragmatic best practices you can apply today.

    Why Indian Enterprises are Adopting Cloud (Fast)

    There are three business drivers behind the cloud push:

    • Speed & agility. Cloud lets teams provision infrastructure in minutes instead of weeks, accelerating development cycles and product launches.

    • Scalability & resilience. On-demand scaling helps enterprises handle peak loads and ensures business continuity without heavy upfront capital.

    • Data & AI readiness. Cloud platforms provide managed data, ML, and analytics services that make it far easier to build AI capabilities.

    Most organizations are not choosing a single cloud — multi-cloud and hybrid strategies are now the norm as companies balance regulatory, performance, and cost concerns. Over 70% of enterprises are reported to be pursuing multi-cloud or hybrid strategies to keep flexibility and avoid vendor lock-in.

    Tangible Benefits of Cloud Adoption

    Cloud adoption delivers measurable business outcomes. The most common benefits Indian enterprises report include:

    • Faster innovation: Faster provisioning and managed services reduce friction for development and experimentation.

    • Cost flexibility: OPEX model reduces capital expenditure and converts fixed costs into variable costs tied to usage.

    • Operational efficiency: Managed services (databases, messaging, monitoring) reduce operational burden and free internal teams for higher-value work.

    • Improved reliability: Built-in redundancy, geo-replication, and managed backups increase uptime and data durability.

    • Better data insights: Cloud analytics and data lake services make it easier to centralize data and derive insights for decision-making.

    These benefits are particularly important when organizations pursue AI initiatives: the cloud provides the GPU, storage, and orchestration layers needed for training and inference at scale (and for cost predictability if managed correctly). Gartner and industry analysts continue to emphasize the cloud as the foundation for modern AI deployments.

    Top challenges Indian enterprises must anticipate

    Cloud brings new failure modes that often surprise teams moving from on-prem environments. The most common pain points are:

    1. Security & misconfiguration risks. Misconfigured cloud services (public buckets, overly permissive IAM roles, exposed APIs) are a major source of breaches and data exposure. Industry reports show misconfiguration and limited visibility remain top cloud security issues.

    2. Cost overruns & poor governance. Many teams struggle with cost visibility and uncontrolled spend across accounts and projects — 94% of IT decision-makers in one survey reported trouble managing cloud costs. Unplanned AI/ML workloads only magnify this.

    3. Complexity of hybrid/multi-cloud operations. Managing multiple providers, regions, and networking models increases operational complexity and skill requirements.

    4. Skill gaps & cultural change. Shifting to cloud-native practices requires SRE/DevOps skills, FinOps maturity, and changes to procurement and architecture reviews.

    5. Compliance & data residency. Industry regulations and data residency requirements drive architecture decisions (edge, region selection, on-prem fallbacks).

    6. Vendor lock-in concerns. Overuse of provider-specific managed services can limit portability; enterprises need strategies that balance managed services with portability.

    Understanding these threats up front helps you plan compensating controls and governance early — the organizations that treat cloud adoption as a cross-functional business program (not just an IT lift) achieve better outcomes. Recent industry reviews note that while cloud value is large, many transformations fall short without operational excellence and clear governance.

    Practical Best Practices for Successful Cloud Adoption

    Adopt the cloud intentionally — use a structured, phased approach that balances speed with governance.

    1. Start with a business-first cloud strategy

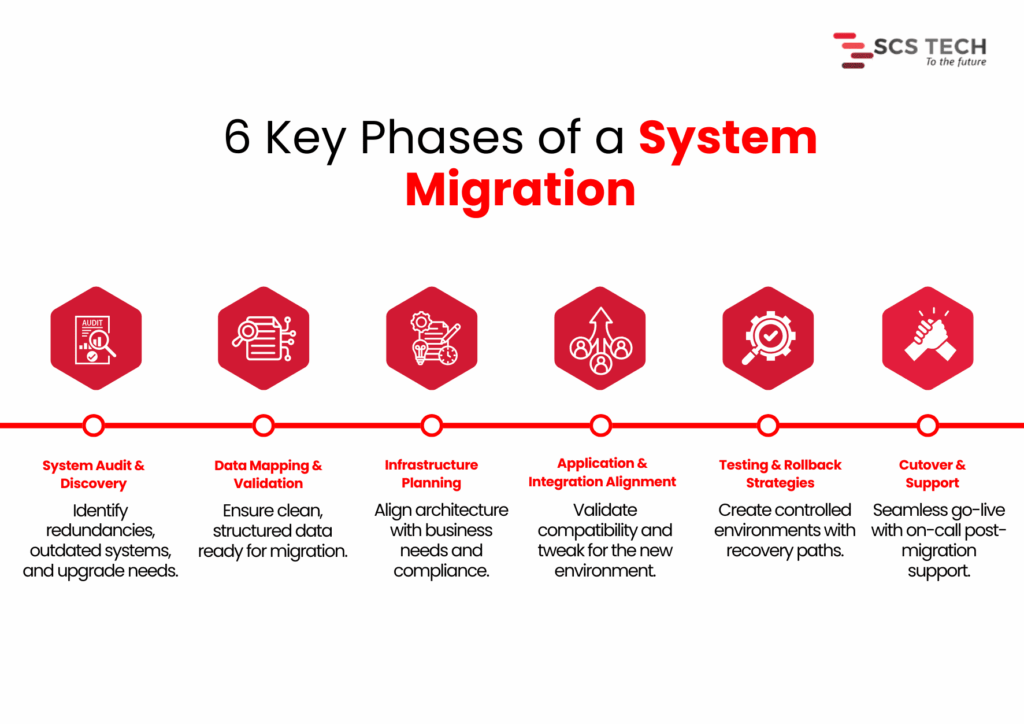
    Document business outcomes (time-to-market, cost targets, compliance needs) and map workloads to those outcomes. Not every workload should move at once; classify workloads as rehost, replatform, refactor, or retain and prioritize.

    2. Build a Cloud Adoption Framework (CAF)

    Use a proven framework (Azure CAF, AWS Well-Architected, Google Cloud Architecture Framework) to define landing zones, identity patterns, network topology, and security baselines. A CAF standardizes configurations and reduces misconfiguration risk.

    3. Implement Zero Trust and cloud-native security controls

    Adopt a Zero Trust mindset: least privilege IAM, encryption in transit and at rest, private networking for sensitive workloads, and strong secrets management. Automate security checks into CI/CD pipelines and perform continuous posture assessments.

    4. Make cost governance a first-class capability (FinOps)

    Create tagging and chargeback models, enforce budget alerts, and centralize cost reporting. Regularly review idle resources, leverage savings plans/reserved instances where appropriate, and run rightsizing recommendations. Treat FinOps as an ongoing operating discipline.

    5. Automate everything (IaC & SRE principles)

    Use Infrastructure as Code (Terraform/ARM/CloudFormation) to create reproducible environments and reduce configuration drift. Embed SRE practices: SLIs, SLOs, and runbooks so teams measure reliability and automate recovery.

    6. Start small, prove value, then scale

    Run pilot migrations for high-value but low-risk workloads. Use pilot outcomes to refine migration playbooks, security controls, and operational runbooks before large-scale migration.

    7. Invest in people and change management

    Upskill developers and operations staff on cloud patterns, DevOps, and FinOps. Create cross-functional pods that include security, compliance, finance, and infrastructure to accelerate decisions and reduce handoffs.

    8. Secure the supply chain and third parties

    Assess vendor security posture, require contractual security controls, and monitor third-party integrations. Supply-chain compromises often originate through trusted partners.

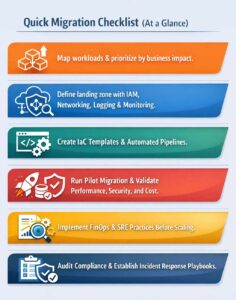
    Quick Migration Checklist

    Cloud Migration Checklist

    Measuring success: KPIs that matter

    Track metrics that align to business outcomes, for example:

    • Time to provision environment (minutes)

    • Mean time to recovery (MTTR) for production incidents

    • Cloud spend variance vs budget (%)

    • Percentage of workloads in approved landing zones (%)

    • Application availability/SLA compliance (%)

    • Deployment frequency and lead time for changes

    Use these KPIs to continually improve tooling, governance, and the operating model.

    Cloud Adoption is a Journey, Not a Switch

    Cloud adoption can be transformational: faster product cycles, modern analytics, and a platform for AI innovation. But the upside requires disciplined governance, security by design, cost accountability, and a cultural shift toward automation and continuous improvement. Indian enterprises that combine a business-led strategy with proven cloud adoption frameworks and operational excellence will extract the most value — while avoiding the common pitfalls of misconfiguration, runaway costs, and weak governance.

    For organizations navigating this journey, having the right technology partner can significantly reduce complexity and risk. SCS Tech India supports enterprises at every stage of cloud adoption—from strategy and secure architecture design to migration, optimization, and ongoing governance—ensuring cloud investments deliver measurable business value.

  • How AI & ML Are Transforming Digital Transformation in 2026

    How AI & ML Are Transforming Digital Transformation in 2026

    Digital transformation has evolved from a forward-looking strategy into a fundamental requirement for operational success. As India moves deeper into 2026, organizations across industries are recognizing that traditional digital transformation approaches are no longer enough. What truly accelerates transformation today is the integration of Artificial Intelligence (AI) and Machine Learning (ML) into core business systems.

    Unlike earlier years, where AI was viewed as an advanced technology reserved for innovation labs, it is now embedded in everyday operational workflows. Whether it’s streamlining supply chains, automating customer interactions, predicting equipment failures, or enhancing cybersecurity, AI and ML are enabling organizations to move from reactive functioning to proactive, intelligent operations.

    In this blog, we explore how AI and ML are reshaping digital transformation in 2026, what trends are driving adoption, and how enterprises in India can leverage these technologies to build a future-ready business.

    AI & ML: The Foundation of Modern Digital Transformation

    AI and ML have become the backbone of digital transformation because they allow organizations to process large amounts of data, identify patterns, automate decisions, and optimize workflows in real time. Companies are no longer implementing AI as an “optional enhancement” — instead, AI is becoming the central engine of digital operations.

    At its core, AI-powered digital transformation enables companies to achieve what previously required human intervention, multiple tools, and considerable resources. Now, tasks that once took hours or days can be completed within minutes, and with far higher accuracy.

    AI & ML empower enterprises to:

    • Improve decision-making through real-time insights

    • Understand customer behavior with greater precision

    • Optimize resources and reduce operational waste

    • Enhance productivity through intelligent automation

    • Strengthen cybersecurity using predictive intelligence

    This shift toward AI-first strategies is defining the competitive landscape in 2026.

    Key AI & ML Trends Driving Digital Transformation in 2026

    AI capabilities are expanding rapidly, and these advancements are shaping how organizations modernize their digital ecosystems. The following trends are particularly influential this year.

    a) Hyper-Automation as the New Operational Standard

    Hyper-automation integrates AI, ML, and RPA to automate complex business processes end-to-end. Organizations are moving beyond basic automation to create fully intelligent workflows that require minimal manual oversight.

    Many enterprises are using hyper-automation to streamline back-office operations, accelerate service delivery, and reduce human errors. For instance, financial services companies can now process loan applications, detect fraud, and verify customer documents with near-perfect accuracy in a fraction of the usual time.

    Businesses rely on hyper-automation for:

    • Smart workflow routing

    • Automated document processing

    • Advanced customer onboarding

    • Predictive supply chain operations

    • Real-time process optimization

    The efficiency gains are substantial, often reducing operational costs by 20–40%.

    b) Predictive Analytics for Data-Driven Decision Making

    Data is the most valuable asset of modern enterprises — but it becomes meaningful only when organizations can interpret it accurately. Predictive analytics enables businesses to forecast events, trends, and behaviors using historical and real-time data.

    In 2026, predictive analytics will be used across multiple functions. Manufacturers rely on it to anticipate machine breakdowns before they occur. Retailers use it to forecast demand fluctuations. Financial institutions apply it to assess credit risks with greater accuracy.

    Predictive analytics helps organizations:

    • Reduce downtime

    • Improve financial planning

    • Understand market movements

    • Personalize customer experiences

    • Prevent operational disruptions

    Companies that adopt predictive analytics experience greater agility and competitiveness.

    c) AI-Driven Cybersecurity and Threat Intelligence

    As organizations expand digitally, cyber threats have grown more complex. With manual monitoring proving insufficient, AI-based cybersecurity solutions are becoming essential.

    AI enhances security by continuously analyzing network patterns, identifying anomalies, and responding to threats instantly. This real-time protection helps organizations mitigate attacks before they escalate.

    AI-powered cybersecurity enables:

    • Behavioral monitoring of users and systems

    • Automated detection of suspicious activity

    • Early identification of vulnerabilities

    • Prevention of data breaches

    • Continuous incident response

    Industries such as BFSI, telecom, and government depend heavily on AI-driven cyber resilience.

    d) Intelligent Cloud Platforms for Scalability and Efficiency

    The cloud is no longer just a storage solution — it has become an intelligent operational platform. Cloud service providers now integrate AI into the core of their services to enhance scalability, security, and flexibility.

    AI-driven cloud systems can predict demand, allocate resources automatically, and detect potential failures before they occur. This results in faster applications, reduced costs, and higher reliability.

    Intelligent cloud technology supports digital transformation by enabling companies to innovate rapidly without heavy infrastructure investments.

    e) Generative AI for Enterprise Productivity

    Generative AI (GenAI) has revolutionized enterprise workflows. Beyond creating text or images, GenAI now assists in tasks such as documentation, coding, research, and training.

    Instead of spending hours creating technical manuals, training modules, or product descriptions, employees can now generate accurate drafts within minutes and refine them as needed.

    GenAI enhances productivity through:

    • Automated content generation

    • Rapid prototyping and simulations

    • Code generation and debugging

    • Data summarization and analysis

    • Knowledge management

    Organizations using GenAI report productivity improvements of 35–60%.

    Generative AI Tools for Enterprise Productivity

    How AI Is Transforming Key Industries in India

    AI adoption varies across industries, but the impact is widespread and growing. Below are some sectors experiencing notable transformation.

    Healthcare

    AI is revolutionizing diagnostics, patient management, and clinical decision-making in India.
    Hospitals use AI-enabled tools to analyze patient records, medical images, and vital signs, helping doctors make faster and more accurate diagnoses.

    Additionally, predictive analytics helps healthcare providers anticipate patient needs and plan treatments more effectively. Automated hospital management systems further improve patient experience and reduce administrative workload.

    Banking & Financial Services (BFSI)

    The BFSI sector depends on AI for security, customer experience, and operational efficiency.
    Banks now use AI-based systems to detect fraudulent transactions, assess creditworthiness, automate customer service, and enhance compliance.

    With the rise of digital payments and online banking, AI enables financial institutions to maintain trust while delivering seamless customer experiences.

    Manufacturing

    Manufacturers in India are integrating AI into production lines, supply chain systems, and equipment monitoring.
    AI-driven predictive maintenance significantly reduces downtime, while computer vision tools perform real-time quality checks to maintain consistency across products.

    Digital twins — virtual replicas of physical systems — allow manufacturers to test processes and optimize performance before actual deployment.

    Retail & E-Commerce

    AI helps retail companies understand customer preferences, forecast demand, manage inventory, and optimize pricing strategies.
    E-commerce platforms use AI-powered recommendation engines to deliver highly personalized shopping experiences, leading to higher conversion rates and increased customer loyalty.

    Government & Smart Cities

    Smart city initiatives across India use AI for traffic management, surveillance, GIS mapping, and incident response.
    Government services are becoming more citizen-friendly by automating workflows such as applications, approvals, and public queries.

    Benefits of AI & ML in Digital Transformation

    AI brings measurable improvements across multiple aspects of business operations.

    Key benefits include:

    • Faster and more accurate decision-making

    • Higher productivity through automation

    • Reduction in operational costs

    • Enhanced customer experiences

    • Stronger security and risk management

    • Increased agility and innovation

    These advantages position AI-enabled enterprises for long-term success.

    Challenges Enterprises Face While Adopting AI

    Despite its potential, AI implementation comes with challenges.

    Common barriers include:

    • Lack of AI strategy or roadmap

    • Poor data quality or fragmented data

    • Shortage of skilled AI professionals

    • High initial implementation costs

    • Integration issues with legacy systems

    • Concerns around security and ethics

    Understanding these challenges helps organizations plan better and avoid costly mistakes.

    How Enterprises Can Prepare for AI-Powered Transformation

    Organizations must take a structured approach to benefit fully from AI.

    Steps to build AI readiness:

    • Define a clear AI strategy aligned with business goals

    • Invest in strong data management and analytics systems

    • Adopt scalable cloud platforms to support AI workloads

    • Upskill internal teams in data science and automation technologies

    • Start small—test AI in pilot projects before enterprise-wide rollout

    • Partner with experienced digital transformation providers

    A guided, phased approach minimizes risks and maximizes ROI.

    Why Partner with SCS Tech India for AI-Led Digital Transformation?

    SCS Tech India is committed to helping organizations leverage AI to its fullest potential. With expertise spanning digital transformation, AI/ML engineering, cybersecurity, cloud technology, and GIS solutions, the company delivers results-driven transformation strategies.

    Organizations choose SCS Tech India because of:

    • Proven experience across enterprise sectors

    • Strong AI and ML development capabilities

    • Scalable and secure cloud and data solutions

    • Deep expertise in cybersecurity

    • Tailored transformation strategies for each client

    • A mature, outcome-focused implementation approach

    Whether an enterprise is beginning its AI journey or scaling across departments, SCS Tech India provides end-to-end guidance and execution.

    Wrapping Up!

    AI and Machine Learning are redefining what digital transformation means in 2026. These technologies are enabling organizations to move faster, work smarter, and innovate continuously. Companies that invest in AI today will lead their industries tomorrow.

    Digital transformation is no longer just about adopting new technology — it’s about building an intelligent, agile, and future-ready enterprise. With the right strategy and partners like SCS Tech India, businesses can unlock unprecedented levels of efficiency, resilience, and growth.

  • How Custom Software Can Reduce Operational Bottlenecks Across Departments

    How Custom Software Can Reduce Operational Bottlenecks Across Departments

    Ever feel like your teams are working hard, but projects still drag on? Delays, repeated approvals, and miscommunication can quietly eat away at productivity. The culprit is often operational bottlenecks, those invisible slow points that hold your entire workflow back.

    The good news? With the right custom software, you can target these bottlenecks head-on, streamline operations, and help every department move faster and smarter.

    What Are Operational Bottlenecks and Why They Happen

    Operational bottlenecks happen when one step in a process slows down the entire workflow. Think of it like a traffic jam inside your company: one department gets stuck, and everything else piles up behind it.

    Common causes include:

    • Manual approvals – Tasks like expense approvals or HR requests can take days instead of hours.
    • Disconnected systems – When your CRM, ERP, and project management tools don’t talk to each other, duplicate effort and errors pile up.
    • Poor communication – Delayed updates or unclear responsibilities leave teams waiting on answers.
    • Repetitive tasks – Time-consuming manual work steals focus from higher-value activities.

    For example, a finance team manually reconciling invoices across multiple platforms might spend 10+ hours a week on a task that could be automated in minutes. Identifying these bottlenecks is the first step to freeing up time, reducing errors, and keeping your operations moving smoothly.

    How Custom Software Targets Bottlenecks Across Departments

    Custom software isn’t just about replacing old tools, it’s about making your workflows smarter, faster, and more connected. By tailoring solutions to your company’s unique processes, you can tackle bottlenecks at their source, so every department works more efficiently and teams spend less time chasing approvals or fixing errors.

    Streamlining Communication

    Think about your workflow as a chain: it’s only as fast as the slowest link. In many organizations, that link is communication. Delayed approvals, missed messages, or unclear responsibilities create a multiplier effect, one small delay can ripple across teams, slowing multiple projects at once.

    Custom software addresses this by:

    • Automating notifications and reminders – Industry research shows automation of routine business processes can reduce operational delays by up to ~40%, cutting much of the waiting time caused by manual handoffs
    • Centralized dashboards – Instead of searching across emails, files, or chat apps, teams see the status of tasks at a glance. This follows the information visibility model, where quicker access to key data directly speeds decision-making.
    • Integrated collaboration tools – Chat, comments, and task assignments in one place reduce time lost to context-switching; studies show knowledge workers spend roughly 2.5 hours per day searching for information or recovering from interruptions, and interruptions typically require ~20–25 minutes to fully refocus on a task.

    For example, approvals that normally take 3 days can be reduced to a few hours. By removing friction from communication, teams can focus on execution instead of coordination, drastically reducing bottlenecks that often stall operations without anyone realizing it.

    Automating Repetitive Tasks

    Repetitive tasks are productivity killers. When teams spend hours on manual work, like entering data, reconciling spreadsheets, or generating reports, it’s not just time lost; it’s opportunity cost. According to the Pareto principle, roughly 20% of tasks generate 80% of value, meaning most repetitive work contributes little to strategic outcomes.

    Custom software reduces these bottlenecks by:

    • Automating manual processes – HR approvals, invoice processing, or inventory updates can be executed automatically, freeing your team to focus on high-value work.
    • Reducing human error – Manual repetition increases the likelihood of mistakes, which can ripple downstream and cause rework. Automation follows the error reduction mental model, where reliability increases exponentially when routine tasks are systematized.
    • Tracking workflows in real time – Software ensures every step is logged, measurable, and traceable, making it easier to spot and fix inefficiencies.

    For instance, finance teams spending 10 hours a week reconciling data across platforms could cut that time to under an hour with automation. Across HR, operations, and administration, automating repetitive tasks not only accelerates processes but also boosts accuracy and employee satisfaction, turning bottlenecks into streamlined workflows.

    Integrating Disparate Systems

    Disconnected systems are a hidden source of bottlenecks. When your CRM, ERP, and project management tools don’t communicate, employees spend time duplicating work, reconciling data, and chasing updates, a classic example of the friction cost mental model, where each handoff adds delays and errors.

    Custom software solves this by:

    • Creating seamless connections between platforms – Data flows automatically between systems, reducing manual transfers and inconsistencies.
    • Eliminating redundant tasks – For example, sales updates no longer need to be manually entered into finance or operations systems.
    • Providing a unified view of operations – Teams can see the full picture in real time, enabling faster decisions and proactive bottleneck management.

    Consider a scenario where marketing, sales, and customer support each maintain separate databases. Integrating these systems has been shown in multiple case studies to boost operational efficiency by up to ~30%, reduce redundant data entry, and streamline reporting—helping cut duplicated effort and accelerate responses. 

    By breaking down these silos, custom software ensures that your departments aren’t working in isolation, and information flows smoothly from one team to another.

    Real-Time Data & Reporting

    Bottlenecks often appear because decisions are made on outdated or incomplete information. Waiting for reports or manually compiling data introduces delays and increases the risk of errors, a classic example of the information latency mental model, where the value of information decreases the longer it takes to reach decision-makers.

    Custom software tackles this by:

    • Providing live dashboards – Teams can monitor KPIs, approvals, and workflows in real time without waiting for end-of-day or weekly reports.
    • Enabling proactive decision-making – Alerts and insights flag issues before they become bottlenecks, allowing teams to act immediately.
    • Reducing report preparation time – Automated reporting frees employees from manual data compilation, cutting hours or even days from critical processes.

    For instance, a sales manager tracking leads across multiple platforms might spend 5–7 hours weekly consolidating data. With real-time reporting, that time drops to minutes, enabling faster follow-ups and better pipeline management. By giving teams timely, actionable insights, custom software transforms bottlenecks from hidden slowdowns into opportunities for efficiency.

    Next Steps

    Custom software development has the power to remove bottlenecks, streamline workflows, and give your teams more time for high-value work. From operations and finance to HR and sales, the right solution makes processes faster, more reliable, and easier to manage.

    At SCSTech, we specialize in designing and implementing custom software that addresses your unique operational challenges. Our experts work closely with you to identify pain points, create tailored solutions, and ensure smooth adoption across departments.

    Contact SCSTech today to speak with our experts and discover how custom software can transform bottlenecks into seamless, high-efficiency workflows for your business.

  • How to Audit Your Existing Tech Stack Before Starting a Digital Transformation Project

    How to Audit Your Existing Tech Stack Before Starting a Digital Transformation Project

    Before you begin any digital transformations, you need to see what you’ve got. Most teams are using dozens of tools throughout their departments, and for the most part, they are underutilized, do not connect with one another, or are not in alignment with the current objectives. 

    The tech stack audit is what helps you identify your tools, how they fit together, and where you have gaps or threats. If you haven’t done this process, even the best digital plans can wilt due to slowdowns, increased expenses, or breaches of security.

    This guide guides you step-by-step in how to do an audit of your stack properly, so your digital transformation starts from a good foundation, not with new software.

    What Is a Tech Stack Audit?

    A tech stack audit reviews all the software, platforms, and integrations being used in your business. It checks how well these components integrate, how well they execute, and how they align with your digital transformation goals.

    A fragmented or outdated stack can slow progress and increase risk. According to Struto, outdated or incompatible tools “can hinder performance, compromise security, and impede the ability to scale.”

    Poor data, redundant tools, and technical debt are common issues. Poor team morale and inefficiencies ensue, according to Brightdials, as stacks become unstructured or unmaintained.

    Core benefits of a thorough audit

    1. Improved performance. Audits reveal system slowdowns and bottlenecks. Fixing them can lead to faster response times and higher user satisfaction. Streamlining outdated systems through tech digital solutions can unlock performance gains that weren’t previously possible.
    2. Cost reduction. You may discover unneeded licenses, redundant software, or shadow IT. One firm saved $20,000 annually after it discovered a few unused tools.
    3. Improved security and compliance. Auditing reveals stale or exposed pieces. It avoids compliance mistakes and reduces the attack surface.
    4. Better scalability and future-proofing. An audit shows what tools will be scalable with growth or need to be replaced before new needs drive them beyond their usefulness.

    Step-by-Step Process to Conduct a Tech Stack Audit

    It is only logical to understand what you already have and how well it is working before you begin any digital transformation program. The majority of organizations go in for new tools and platforms without checking their current systems properly. That leads to problems later on.

    A systematic tech stack review makes sense. It will inform you about what to keep, what to phase out, and what to upgrade. More importantly, it ensures your transformation isn’t based on outdated, replicated, or fragmented systems.

    The following is the step-by-step approach we suggest, in the way that we assist teams in getting ready for effective, low-risk digital transformation.

    Step 1: Create a Complete Inventory of Your Tech Stack

    Start by listing every tool, platform, and integration your organization currently uses. This includes everything from your core infrastructure (servers, databases, CRMs, ERPs) to communication tools, collaboration apps, third-party integrations, and internal utilities developed in-house.

    And it needs to be complete, not skimpy.

    Go by department or function. So:

    • Marketing may be employing an email automation tool, a customer data platform, social scheduling apps, and analytics dashboards.
    • Sales can have CRM, proposal tools, contract administration, and billing integration.
    • Operations can have inventory platforms, scheduling tools, and reporting tools.
    • IT will deal with infrastructure, security, endpoint management, identity access, and monitoring tools.

    Also account for:

    • Licensing details: Is the tool actively paid for or in trial phase?
    • Usage level: Is the team using it daily, occasionally, or not at all?
    • Ownership: Who’s responsible for managing the tool internally?
    • Integration points: Does this tool connect with other systems or stand alone?

    Be careful to include tools that are rarely talked about, like those used by one specific team, or tools procured by individual managers outside of central IT (also known as shadow IT).

    A good inventory gives you visibility. Without it, you will probably go about attempting to modernize against tools that you didn’t know were still running or lose the opportunity to consolidate where it makes sense.

    We recommend keeping this inventory in a shared spreadsheet or software auditing tool. Keep it up to date with all stakeholders before progressing to the next stage of the audit. This is often where a digital transformation consultancy can provide a clear-eyed perspective and structured direction.

    Step 2: Evaluate Usage, Cost, and ROI of Each Tool

    Having now made a list of all tools, the next thing is to evaluate if each one is worth retaining. This involves evaluating three things: how much it is being used, its cost, and what real value it provides.

    Start with usage. Talk to the teams who are using each one. Is it part of their regular workflow? Do they use one specific feature or the whole thing? If adoption is low or spotty, it’s a flag to go deeper. Teams tend to stick with a tool just because they know it, more than because it’s the best option.

    Then consider the price. That is the direct cost, such as subscription, license, and renewal. But don’t leave it at that. Add concealed costs: support, training, and the time wasted on troubleshooting. Two resources might have equal initial costs, but the resource that delays or requires constant aid has a higher cost.

    Last but not least, emphasize ROI. This is usually the neglected section. A tool might be used extensively and cheaply, yet it does not automatically mean it performs well. Ask:

    • Does it help your team accomplish objectives faster?
    • Has efficiency or manual labor improved?
    • Has an impact been made that can be measured, e.g., faster onboarding, better customer response time, or cleaner data?

    You don’t need complex math for this—just simple answers. If a tool is costing more than it returns or if a better alternative exists, it must be tagged for replacement, consolidation, or elimination.

    A digital transformation consultant can help you assess ROI with fresh objectivity and prevent emotional attachment from skewing decisions. This ensures that your transformation starts with tools that make progress and not just occupy budget space.

    Step 3: Map Data Flow and System Integrations

    Start by charting how data moves through your systems. How does it begin? Where does it go next? What devices send or receive data, and in what format? This is to pull out the form behind your operations, customer journey, reporting, collaboration, automation, etc.

    Break it up by function:

    • Is your CRM feeding back to your email system?
    • Is your ERP pumping data into inventory or logistics software?
    • How is data from customer support synced with billing or account teams?

    Map these flows visually or in a shared document. List each tool, the data it shares, where it goes, and how (manual export, API, middleware, webhook, etc.).

    While doing this, ask the following:

    • Are there any manual handoffs that slow things down or increase errors?
    • Do any of your tools depend on redundant data entry?
    • Are there any places where data needs to flow but does not?
    • Are your APIs solid, or are they perpetually patch-pending to keep working?

    This step tends to reveal some underlying problems. For instance, a tool might seem valuable when viewed in a vacuum but fails to integrate properly with the remainder of your stack, slowing teams down or building data silos.

    You’ll also likely find tools doing similar jobs in parallel, but not communicating. In those cases, either consolidate them or build better integration paths.

    The point here isn’t merely to view your tech stack; it’s to view how integrated it is. Uncluttered, reliable data flows are one of the best indications that your company is transformation-ready.

    Step 4: Identify Redundancies, Risks, and Outdated Systems

    With your tools and data flow mapped out, look at what is stopping you.

    • Start with redundancies. Do you have more than one tool to fix the same problem? If two systems are processing customer data or reporting, check to see if both are needed or if it is just a relic of an old process.
    • Scan for threats second. Tools that are outdated or tools that are no longer supported by their vendors can leave vulnerabilities. So can systems that use manual operations to function. When a tool fails and there is no defined failover, it’s a threat.
    • Then, assess for outdated systems. These are platforms that don’t integrate well, slow down teams, or can’t scale with your growth plans. Sometimes, you’ll find legacy tools still in use just because they haven’t been replaced, yet they cost more time and money to maintain.

    All of these duplicative, risky, or outdated, demands a decision: sunset it, replace it, or redefine its use. It is done now to avoid complexity in future transformation.

    Step 5: Prioritize Tools to Keep, Replace, or Retire

    With your results from the audit in front of you, sort each tool into three boxes:

    • Keep: In current use, fits well, aids current and future goals.
    • Misaligned, too narrow in scope, or outrun by better alternatives.
    • Retire: Redundant, unused, or imposes unnecessary cost or risk.

    Make decisions based on usage, ROI, integration, and team input. The simplicity of this method will allow you to build a lean, focused stack to power digital transformation without bringing legacy baggage into the future. Choosing the right tech digital solutions ensures your modernization plan aligns with both technical capability and long-term growth.

    Step 6: Build an Action Plan for Tech Stack Modernization

    Use your audit findings to give clear direction. Enumerate what must be implemented, replaced, or phased out with responsibility, timeline, and cost.

    Split it into short- and long-term considerations.

    • Short-term: purge unused tools, eliminate security vulnerabilities, and build useful integrations.
    • Long-term: timeline for new platforms, large migrations, or re-architected markets.

    This is often the phase where a digital transformation consultant can clarify priorities and keep execution grounded in ROI.

    Make sure all stakeholders are aligned by sharing the plan, assigning the work, and tracking progress. This step will turn your audit into a real upgrade roadmap ready to drive your digital transformation.

    Step 7: Set Up a Recurring Tech Stack Audit Process

    An initial audit is useful, but it’s not enough. Your tools will change. Your needs will too.

    Creating a recurring schedule to examine your stack every 6 or 12 months is suitable for most teams. Use the same checklist: usage, cost, integration, performance, and alignment with business goals.

    Make someone in charge of it. Whether it is IT, operations, or a cross-functional lead, consistency is the key.

    This allows you to catch issues sooner, and waste less, while always being prepared for future change, even if it’s not the change you’re currently designing for.

    Conclusion

    A digital transformation project can’t succeed if it’s built on top of disconnected, outdated, or unnecessary systems. That’s why a tech stack audit isn’t a nice-to-have; it’s the starting point. It helps you see what’s working, what’s getting in the way, and what needs to change before you move forward.

    Many companies turn to digital transformation consultancy at this stage to validate their findings and guide the next steps.

    By following a structured audit process, inventorying tools, evaluating usage, mapping data flows, and identifying gaps, you give your team a clear foundation for smarter decisions and smoother execution.

    If you need help assessing your current stack, a digital transformation consultant from SCSTech can guide you through a modernization plan. We work with companies to align technology with real business needs, so tools don’t just sit in your stack; they deliver measurable value. With SCSTech’s expertise in tech digital solutions, your systems evolve into assets that drive efficiency, not just cost.

  • What an IT Consultant Actually Does During a Major Systems Migration

    What an IT Consultant Actually Does During a Major Systems Migration

    System migrations don’t fail because the tools were wrong. They fail when planning gaps go unnoticed, and operational details get overlooked. That’s where most of the risk lies, not in execution, but in the lack of structure leading up to it.

    If you’re working on a major system migration, you already know what’s at stake: missed deadlines, broken integrations, user downtime, and unexpected costs. What’s often unclear is what an IT consultant actually does to prevent those outcomes.

    This article breaks that down. It shows you what a skilled consultant handles before, during, and after migration, not just the technical steps, but how the entire process is scoped, sequenced, and stabilized. An experienced IT consulting firm brings that orchestration by offering more than technical support; it provides migration governance end-to-end.

    What a Systems Migration Actually Involves

    System migration is not simply relocating data from a source environment to a target environment. It is a multi-layered process with implications on infrastructure, applications, workflows, and in most scenarios, how entire teams function once migrated.

    System migration is fundamentally a process of replacing or upgrading the infrastructure of an organization’s digital environment. It may be migrating from legacy to contemporary systems, relocating workloads to the cloud, or combining several environments into one. Whatever the size, however, the process is not usually simple.

    Why? Because errors at this stage are expensive.

    • According to Bloor Research, 80% of ERP projects run into data migration issues.
    • Planning gaps often lead to overruns. Projects can exceed budgets by up to 30% and delay timelines by up to 41%.
    • In more severe cases, downtime during migration costs range from $137 to $9,000 per minute, depending on company size and system scale.

    That’s why companies do not merely require a service provider. They need an experienced IT consultancy that can translate technical migration into strategic, business-aligned decisions from the outset.

    A complete system migration will involve:

    “6 Key Phases of a System Migration”

    Key Phases of a System Migration

    • System audit and discovery — Determining what is being used, what is redundant, and what requires an upgrade.
    • Data mapping and validation — Satisfying that key data already exists, needs to be cleaned up, and is ready to be transferred without loss or corruption.
    • Infrastructure planning — Aligning the new systems against business objectives, user load, regulatory requirements, and performance requirements.
    • Application and integration alignment — Ensuring that current tools and processes are accommodated or modified for the new configuration.
    • Testing and rollback strategies — Minimizing service interruption by testing everything within controlled environments.
    • Cutover and support — Handling go-live transitions, reducing downtime, and having post-migration support available.

    Each of these stages carries its own risks. Without clarity, preparation, and skilled handling, even minor errors in the early phase can multiply into budget overruns, user disruption, or worse, permanent data loss.

    The Critical Role of an IT Consultant: Step by Step

    When system migration is on the cards, technical configuration isn’t everything. How the project is framed, monitored, and managed is what typically determines success.

    At SCS Tech, we own up to making that framework explicit from the beginning. We’re not just executioners. We remain clear through planning, coordination, testing, and transition, so the migration can proceed with reduced risk and improved decisions.

    Here, we’ve outlined how we work on large migrations, what we do, and why it’s important at every stage.

    Pre-Migration Assessment

    Prior to making any decisions, we first figure out what the world is like today. This is not a technical exercise. How systems are presently configured, where data resides, and how it transfers between tools, all of this has a direct impact on how a migration needs to be planned.

    We treat the pre-migration assessment as a diagnostic step. The goal is to uncover potential risks early, so we don’t run into them later during cutover or integration. We also use this stage to help our clients get internal clarity. That means identifying what’s critical, what’s outdated, and where the most dependency or downtime sensitivity exists.

    Here’s how we run this assessment in real projects:

    • First, we conduct a technical inventory. We list all current systems, how they’re connected, who owns them, and how they support your business processes. This step prevents surprises later. 
    • Next, we evaluate data readiness. We profile and validate sample datasets to check for accuracy, redundancy, and structure. Without clean data, downstream processes break. Industry research shows projects regularly go 30–41% over time or budget, partly due to poor data handling, and downtime can cost $137 to $9,000 per minute, depending on scale.
    • We also engage stakeholders early: IT, finance, and operations. Their insights help us identify critical systems and pain points that standard tools might miss. A capable IT consulting firm ensures these operational nuances are captured early, avoiding assumptions that often derail the migration later.

    By handling these details up front, we significantly reduce the risk of migration failure and build a clear roadmap for what comes next.

    Migration Planning

    Once the assessment is done, we shift focus to planning how the migration will actually happen. This is where strategy takes shape, not just in terms of timelines and tools, but in how we reduce risk while moving forward with confidence.

    1. Mapping Technical and Operational Dependencies

    Before we move anything, we need to know how systems interact, not just technically, but operationally. A database may connect cleanly to an application on paper, but in practice, it may serve multiple departments with different workflows. We review integration points, batch jobs, user schedules, and interlinked APIs to avoid breakage during cutover.

    Skipping this step is where most silent failures begin. Even if the migration seems successful, missing a hidden dependency can cause failures days or weeks later.

    2. Defining Clear Rollback Paths

    Every migration plan we create includes defined rollback procedures. This means if something doesn’t work as expected, we can restore the original state without creating downtime or data loss. The rollback approach depends on the architecture; sometimes it’s snapshot-based, and sometimes it involves temporary parallel systems.

    We also validate rollback logic during test runs, not after failure. This way, we’re not improvising under pressure.

    3. Choosing the Right Migration Method

    There are typically two approaches here:

    • Big bang: Moving everything at once. This works best when dependencies are minimal and downtime can be tightly controlled.
    • Phased: Moving parts of the system over time. This is better for complex setups where continuity is critical.

    We don’t make this decision in isolation. Our specialized IT consultancy team helps navigate these trade-offs more effectively by aligning the migration model with your operational exposure and tolerance for risk.

    Toolchain & Architecture Decisions

    Choosing the right tools and architecture shapes how smoothly the migration proceeds. We focus on precise, proven decisions, aligned with your systems and business needs.

    We assess your environment and recommend tools that reduce manual effort and risk. For server and VM migrations, options like Azure Migrate, AWS Migration Hub, or Carbonite Migrate are top choices. According to Cloudficient, using structured tools like these can cut manual work by around 40%. For database migrations, services like AWS DMS or Google Database Migration Service automate schema conversion and ensure consistency.

    We examine if your workloads integrate with cloud-native services, such as Azure Functions, AWS Lambda, RDS, or serverless platforms. Efficiency gain makes a difference in the post-migration phase, not just during the move itself.

    Unlike a generic vendor, a focused IT consulting firm selects tools based on system dynamics, not just brand familiarity or platform loyalty.

    Risk Mitigation & Failover Planning

    Every migration has risks. It’s our job at SCS Tech to reduce them from the start and embed safeguards upfront.

    • We begin by listing possible failure points, data corruption, system outages, and performance issues, and rate them by impact and likelihood. This structured risk identification is a core part of any mature information technology consulting engagement, ensuring real-world problems are anticipated, not theorized.
    • We set up backups, snapshots, or parallel environments based on business needs. Blusonic recommends pre-migration backups as essential for safe transitions. SCSTech configures failover systems for critical applications so we can restore service rapidly in case of errors.

    Team Coordination & Knowledge Transfer

    Teams across IT, operations, finance, and end users must stay aligned. 

    • We set a coordinated communication plan that covers status updates, cutover scheduling, and incident escalation.
    • We develop clear runbooks that define who does what during migration day. This removes ambiguity and stops “who’s responsible?” questions in the critical hours.
    • We set up shadow sessions so your team can observe cutover tasks firsthand, whether it’s data validation, DNS handoff, or system restart. This builds confidence and skills, avoiding post-migration dependency on external consultants.
    • After cutover, we schedule workshops covering:
    • System architecture changes
    • New platform controls and best practices
    • Troubleshooting guides and escalation paths

    These post-cutover workshops are one of the ways information technology consulting ensures your internal teams aren’t left with knowledge gaps after going live. By documenting these with your IT teams, we ensure knowledge is embedded before we step back.

    Testing & Post-Migration Stabilization

    A migration isn’t complete when systems go live. Stabilizing and validating the environment ensures everything functions as intended.

    • We test system performance under real-world conditions. Simulated workloads reveal bottlenecks that weren’t visible during planning.
    • We activate monitoring tools like Azure Monitor or AWS CloudWatch to track critical metrics, CPU, I/O, latency, and error rates. Initial stabilization typically takes 1–2 weeks, during which we calibrate thresholds and tune alerts.

    After stabilization, we conduct a review session. We check whether objectives, such as performance benchmarks, uptime goals, and cost limits, were met. We also recommend small-scale optimizations.

    Conclusion

    A successful migration of the system relies less on the tools and more on the way the process is designed upfront. Bad planning, lost dependencies, and poorly defined handoffs are what lead to overruns, downtime, and long-term disruption.

    It’s for this reason that the work of an IT consultant extends beyond execution. It entails converting technical complexity into simple decisions, unifying teams, and constructing the mitigations that ensure the migration remains stable at each point.

    This is what we do at SCS Tech. Our proactive IT consultancy doesn’t just react to migration problems; it preempts them with structured processes, stakeholder clarity, and tested fail-safes.

    We assist organizations through each stage from evaluation and design to testing and after-migration stabilization, without unnecessary overhead. Our process is based on system-level thinking and field-proven procedures that minimize risk, enhance clarity, and maintain operations while changes occur unobtrusively in the background.

    SCS Tech offers expert information technology consulting to scope the best approach, depending on your systems, timelines, and operational priorities.

  • LiDAR vs Photogrammetry: Which One Is Right for Your GIS Deployment?

    LiDAR vs Photogrammetry: Which One Is Right for Your GIS Deployment?

    Both LiDAR and photogrammetry offer the accuracy of spatial data, yet that doesn’t simplify the choice. They fulfill the same function in GIS implementations but do so with drastically different technologies, expenses, and conditions in the field. LiDAR provides laser accuracy, as well as canopy penetration; photogrammetry provides high-resolution visuals, as well as velocity. However, selecting one without knowing where it will succeed or fail means the investment is wasted or the data is compromised.

    Choosing the right technology also directly impacts the success of your GIS services, especially when projects are sensitive to terrain, cost, or delivery timelines.

    This article compares them head-to-head across real-world factors: mapping accuracy, terrain adaptability, processing time, deployment requirements, and cost. You’ll see where one outperforms the other and where a hybrid approach might be smarter.

    LiDAR vs Photogrammetry: Key Differences

    LiDAR and photogrammetry are two of GIS’s most popular techniques for gathering spatial data. Both are intended to record real-world environments but do so in dramatically different manners.

    LiDAR (Light Detection and Ranging) employs laser pulses to estimate distances between a sensor and targets on the terrain. These pulses bounce back towards the sensor to form accurate 3D point clouds. It is functional in many light environments and can even scan through vegetation to map the ground.

    Photogrammetry, however, utilizes overlapping photographs taken from cameras, usually placed on drones or airplanes. These photos are then computer-processed to construct the shape and location of objects in 3D space. It is greatly dependent on favorable lighting and open visibility to produce good results.

    Both methods are supportive of GIS mapping, although one might be more beneficial than the other based on project needs. Here’s where they vary in terms of principal differences:

    • Accuracy in GIS Mapping
    • Terrain Suitability & Environmental Conditions
    • Data Processing & Workflow Integration
    • Hardware & Field Deployment
    • Cost Implications

    Accuracy in GIS Mapping

    When your GIS implementation is contingent upon accurate elevation and surface information, applications such as flood modeling, slope analysis, or infrastructure planning, the quality of your data collection means the project makes it or breaks it.

    LiDAR delivers strong vertical accuracy thanks to laser pulse measurements. Typical airborne LiDAR surveys achieve vertical RMSE (Root Mean Square Error) between 5–15 cm, and in many cases under 10 cm, across various terrain types. Urban or infrastructure-focused LiDAR (like mobile mapping) can even get vertical RMSE down to around 1.5 cm.

    Photogrammetry, on the other hand, provides less accurate vertical accuracy. Generally, most good-quality drone photogrammetry is able to produce around 10–50 cm RMSE in height, although horizontal accuracy is usually 1–3 cm. Tighter vertical accuracy is more difficult to achieve and requires more ground control points, improved image overlap, and good lighting, all require more money and time.

    For instance, an infrastructure corridor that must be accurately elevated to plan drainage may be compromised by photogrammetry alone. A LiDAR survey would be sure to collect the small gradients required for good water flow or grading design, however.

    • Use LiDAR when vertical accuracy is critical, for elevation modeling, flood risk areas, or engineering requirements.
    • Use photogrammetry for horizontal mapping or visual base layers where small elevation errors are acceptable and the cost is a constraint.

    These distinctions are particularly relevant when planning GIS in India, where both urban infrastructure and rural landscapes present diverse elevation and surface data challenges.

    Terrain Suitability & Environmental Conditions

    Choosing between LiDAR and photogrammetry often comes down to the terrain and environmental conditions where you’re collecting data. Each method responds differently based on vegetation, land type, and lighting.

    LiDAR performs well in vegetated and complex situations. Its laser pulses penetrate the thick canopy and produce reliable ground models even with heavy cover. For instance, LiDAR has been found to be trustworthy where there are forest canopies of 30 meters, and it keeps its vertical accuracy within 10–15 cm as opposed to photogrammetry, which usually cannot trace the ground surface under heavy vegetation.

    Photogrammetry excels in flat, open, and well-illuminated conditions. It relies on unobstructed lines of sight and substantial lighting. In open spaces such as fields or urban areas devoid of tree cover, it produces high-resolution images and good horizontal positioning, usually 1–3 cm horizontal accuracy, although vertical accuracy deteriorates to 10–20 cm in uneven terrain or light. 

    Environmental resilience also varies:

    • Lighting and weather: LiDAR is largely unaffected by lighting conditions and can operate at night or under overcast skies. In contrast, photogrammetry requires daylight and consistent lighting to avoid shadows and glare affecting model quality.
    • Terrain complexity: Rugged terrain featuring slopes, cliffs, or mixed surfaces can unduly impact photogrammetry, which relies on visual triangulation. LiDAR’s active sensing covers complex landforms more reliably.

    “LiDAR is particularly strong in dense forest or hilly terrain, like cliffs or steep slopes”.

    Choosing Based on Terrain

    • Heavy vegetation/forests – LiDAR is the obvious choice for accurate ground modeling.
    • Flat, open land with excellent lighting – Photogrammetry is cheap and reliable.
    • Mixed terrain (e.g., farmland with woodland margins) – A hybrid strategy or LiDAR is the safer option.

    In regions like the Western Ghats or Himalayan foothills, GIS services frequently rely on LiDAR to penetrate thick forest cover and ensure accurate ground elevation data.

    Data Processing & Workflow Integration

    LiDAR creates point clouds that require heavy processing. Raw LiDAR data can be hundreds of millions of points per flight. Processing includes noise filtering out, classifying ground vs non-ground returns, and developing surface models such as DEMs and DSMs.

    This usually needs to be done using dedicated software such as LAStools or TerraScan and trained operators. High-volume projects may take weeks to days to process completely, particularly if classification is done manually. With current LiDAR processors that have AI-based classification, processing time can be minimized by up to 50% without a reduction in quality.

    Photogrammetry pipelines revolve around merging overlapping images into 3D models. Tools such as Pix4D or Agisoft Metashape automatically align hundreds of images to create dense point clouds and meshes. Automation is an attractive benefit for companies offering GIS services, allowing them to scale operations without compromising data quality.

    The processing stream is heavy, but very automated. However, image quality is a function of image resolution and overlap. A medium-sized survey might be processed within a few hours on an advanced workstation, compared to a few days with LiDAR. Yet for large sites, photogrammetry can involve more manual cleanup, particularly around shaded or homogeneous surfaces.

    • Choose LiDAR when your team can handle heavy processing demands and needs fully classified ground surfaces for advanced GIS analysis.
    • Choose photogrammetry if you value faster setup, quicker processing, and your project can tolerate some manual data cleanup or has strong GCP support.

    Hardware & Field Deployment

    Field deployment brings different demands. The right hardware ensures smooth and reliable data capture. Here’s how LiDAR and photogrammetry compare on that front.

    LiDAR Deployment

    LiDAR requires both high-capacity drones and specialized sensors. For example, the DJI Zenmuse L2, used with the Matrice 300 RTK or 350 RTK drones, weighs about 1.2 kg and delivers ±4 cm vertical accuracy, scanning up to 240k points per second and penetrating dense canopy effectively. Other sensors, like the Teledyne EchoOne, offer 1.5 cm vertical accuracy from around 120 m altitude on mid-size UAVs.

    These LiDAR-capable drones often weigh over 6 kg without payloads (e.g., Matrice 350 RTK) and can fly for 30–55 minutes, depending on payload weight.

    So, LiDAR deployment requires investment in heavier UAVs, larger batteries, and payload-ready platforms. Setup demands trained crews to calibrate IMUs, GNSS/RTK systems, and sensor mounts. Teams offering GIS consulting often help clients assess which hardware platform suits their project goals, especially when balancing drone specs with terrain complexity.

    Photogrammetry Deployment

    Photogrammetry favors lighter drones and high-resolution cameras. Systems like the DJI Matrice 300 equipped with a 45 MP Zenmuse P1 can achieve 3 cm horizontal and 5 cm vertical accuracy, and map 3 km² in one flight (~55 minutes).

    Success with camera-based systems relies on:

    • Mechanical shutters to avoid image distortion
    • Proper overlaps (80–90%) and stable flight paths 
    • Ground control points (1 per 5–10 acres) using RTK GNSS for centimeter-level geo accuracy

    Most medium-sized surveys run on 32–64 GB RAM workstations with qualified GPUs.

    Deployment Comparison at a Glance


    Aspect  LiDAR Photogrammetry 
    Drone requirements ≥6 kg payload, long battery life 3–6 kg, standard mapping drones
    Sensor setup Laser scanner, IMU/GNSS, calibration needed High-resolution camera, mechanical shutter, GCPs/RTK
    Flight time impact Payload reduces endurance ~20–30% Similar reduction; camera weight less critical
    Crew expertise required High—sensor alignment, real-time monitoring Moderate — flight planning, image quality checks
    Processing infrastructure High-end PC, parallel LiDAR tools 32–128 GB RAM, GPU-enabled for photogrammetry


    LiDAR demands stronger UAV platforms, complex sensor calibration, and heavier payloads, but delivers highly accurate ground models even under foliage.

    Photogrammetry is more accessible, using standard mapping drones and high-resolution cameras. However, it requires careful flight planning, GCP setup, and capable processing hardware.

    Cost Implications

    LiDAR requires a greater initial investment. A full LiDAR system, which comprises a laser scanner, an IMU, a GNSS, and a compatible UAV aircraft, can range from $90,000 to $350,000. Advanced models such as the DJI Zenmuse L2, combined with a Matrice 300 or 350 RTK aircraft, are common in survey-grade undertakings.

    If you’re not buying in bulk, LiDAR data collection services typically begin at about $300 an hour and go higher than $1,000 based on the type of terrain and resolution needed.

    Photogrammetry tools are considerably more affordable. An example is a $2,000 to $20,000 high-resolution drone with a mechanical shutter camera. In most business applications, photogrammetry services are charged at $150-$500 per hour, which makes it a viable alternative for repeat or cost-conscious mapping projects.

    In short, LiDAR costs more to deploy but may save time and manual effort downstream. Photogrammetry is cheaper upfront but demands more fieldwork and careful processing. Your choice depends on the long-term cost of error versus the up-front budget you’re working with.

    A well-executed GIS consulting engagement often clarifies these trade-offs early, helping stakeholders avoid costly over-investment or underperformance.

    Final Take: LiDAR vs Photogrammetry for GIS

    A decision between LiDAR and photogrammetry isn’t so much about specs. It’s about understanding which one fits with your site conditions, data requirements, and the results your project relies on.

    Both are strong suits. LiDAR provides you with improved results on uneven ground, heavy vegetation, and high-precision operations. Photogrammetry provides lean operation when you require rapid, broad sweeps in open spaces. But the true potential lies in combining them, with one complementing the other where it is needed.

    If you’re unsure which direction to take, a focused GIS consulting session with SCSTech can save weeks of rework and ensure your spatial data acquisition is aligned with project outcomes. Whether you’re working on smart city development or agricultural mapping, selecting the right remote sensing method is crucial for scalable GIS projects in India.

    We don’t just provide LiDAR or photogrammetry; our GIS services are tailored to deliver the right solution for your project’s scale and complexity.

    Consult with SCSTech to get a clear, technical answer on what fits your project, before you invest more time or budget in the wrong direction.

  • How to Build a Digital Roadmap for Upstream Oil and Gas Operations

    How to Build a Digital Roadmap for Upstream Oil and Gas Operations

    Most upstream oil and gas teams already use some form of digital tools, whether it’s SCADA systems, production monitoring software, or sensor data from the field. These are all examples of oil and gas technology that play a critical role in modernizing upstream workflows.

    But in many cases, these tools don’t work well together. The result? Missed opportunities, duplicated effort, and slow decisions.

    A digital roadmap helps fix that. It gives you a clear plan to use technology in ways that actually improve drilling, production, and asset reliability, not by adding more tools, but by using the right ones in the right places.

    This article outlines the important elements for developing a viable, execution-ready plan specific to upstream operations.

    What a Digital Roadmap Looks Like in Upstream Oil and Gas

    In upstream oil and gas, a digital roadmap isn’t a general IT plan; it’s an execution-driven guide tailored for field operations across drilling, production, and asset reliability. These roadmaps prioritize production efficiency, not buzzword technology.

    A practical digital transformation in oil and gas depends on grounding innovation in field-level reality, not just boardroom strategy.

    Most upstream firms are using technologies like SCADA or reservoir software, but these often remain siloed.  A smart roadmap connects the dots, taking fragmented tools and turning them into a system that generates measurable value in the field.

    Here’s what to include:

    • Use Case Alignment – Focus on high-impact upstream areas: drilling automation, asset integrity, reservoir management, and predictive maintenance. McKinsey estimates digital tech can reduce upstream operating costs by 3–5 % and capex by up to 20 %.
    • Targeted Technology Mapping – Defining where AI/IOT or advanced analytics fit into daily operations is invaluable.  This is where next-gen oil and gas technology, such as edge computing and real-time analytics, can proactively prevent failure and improve uptime.
    • Data Infrastructure Planning – Address how real-time well data, sensor streams, and historical logs are collected and unified. McKinsey highlights that 70 % of oil firms stall in pilot phases due to fragmented data systems and a lack of integrated OT/IT infrastructure.
    • Phased Rollout Strategy – Begin with focused pilots, like real-time drilling performance tracking, then expand to multiple fields. Shell and Chevron have successfully used this playbook: validating gains at a small scale before scaling asset-wide


    Rather than a one-size-fits-all framework, a strong upstream digital roadmap is asset-specific, measurable, and built for execution, not just strategy decks. It helps upstream companies avoid digitizing for the sake of it, and instead focus on what actually moves the needle in the field.

    Building a Digital Roadmap for Upstream Oil and Gas Operations

    A digital roadmap helps upstream oil and gas teams plan how and where to use technology across their operations. It’s not just about picking new tools, it’s about making sure those tools actually improve drilling, production, and day-to-day fieldwork. 

    The following are the critical steps to creating a roadmap that supports real goals, not just upgrades to digital.

    Step 1: Define Business Priorities and Operational Pain Points

    Before looking at any technology, you need to clearly understand what problem you’re trying to solve – that’s step one to building a digital roadmap that works, not just for corporate, but also for the people who are running wells, rigs, and operations every day.

    This starts by answering one question: What are the business outcomes your upstream team needs to improve in the next 12–24 months?

    It could be:

    • Reducing non-productive time (NPT) in drilling operations
    • Improving the uptime of compressors, pumps, or separators
    • Lowering the cost per barrel in mature fields
    • Meeting environmental compliance more efficiently
    • Speeding up production reporting across locations

    These are not just IT problems; they’re business priorities that must shape your digital plan.

    For each priority, define the metric that tells you whether you’re moving in the right direction.

    Business priority  Metric to track 
    Reduce NPT in drilling  Avg. non-productive hours per rig/month 
    Improve asset reliability  Unplanned downtime hours pre-asset 
    Lower operational costs  Costs per barrel (OPEX) 
    Meet ESG reporting requirements  Time to compile and validate compliance data 


    It is simple to understand which digital use cases merit efforts once you have assigned numbers to the goals you established. This is where strategic oil and gas industry consulting adds value by turning operational pain points into measurable digital opportunities.

    Step 2: Audit Your Existing Digital Capabilities and Gaps

    Now that you have the agreed consideration for what priorities you want to strengthen in your upstream activities, the second step is to identify your existing data capabilities, tools, and systems, and assess how well they support what you want to achieve.

    It is not an inventory of software. You’re reviewing:

    • What you have
    • What you’re underutilizing
    • What’s old or difficult to scale
    • And what you’re completely lacking

    Pillars of Digital Readiness Audit

    A successful digital transformation in oil and gas starts with a clear-eyed view of your current tools, gaps, and data flows.

    Focus Areas for a Practical Digital Audit

    Your audit should consider five priority areas:

    1. Field Data Capture
      • Do you still use manual logs or spreadsheets for day-to-day production, asset status, or safety reports?
      • Do you have sensors or edge devices? Are they available and connected?
      • Is field data captured in real-time or batched uploads?
    2. System Integration
      • Are SCADA, ERP, maintenance software, and reporting tools communicating?
      • Are workflows between systems automated or manually exported/imported?
    3. Data Quality and Accessibility
      • How up-to-date, complete, and clean is your operational data?
      • Do engineers and analysts access insights easily, or do they depend on IT every time?
    4. User Adoption and Digital Skill Levels
      • Are digital tools easy to use by field teams?
      • Is there ongoing training for digital tools besides initial rollouts?
    5. Infrastructure Readiness
      • Are you running on cloud, on-premises, or a hybrid setup?
      • Do remote sites have enough connectivity to support real-time monitoring or analytics?

    Step 3: Prioritize High-Impact Use Cases for Digitization

    A digital roadmap fails when it attempts to do too much or gets the wrong priorities. That’s why this step is about selecting the correct digital use cases to begin with.

    You don’t require a long list. You require the correct 3–5 use cases that align with your field requirements, provide early traction, and enable you to gain momentum.

    How to Select and Prioritize the Right Use Cases

    Use three filters:

    • Business Impact

    Does it materially contribute to your objectives from Step 1? Can it decrease downtime, save money, enhance safety, or accelerate reporting?

    • Feasibility

    Do you have sufficient data and infrastructure to enable it? Can you deploy it with your existing team or partners?

    • Scalability

    If it works in one site, can you expand it across other wells, rigs, or regions?

    Plot your candidates on a simple Impact vs. Effort matrix and focus first on the high-impact, low-effort quadrant.

    These examples have been validated industry-wide in both onshore and offshore environments:

    Use cases  What it solves  Why it works 
    Predictive maintenance for rotating equipment  Unexpected failures, costly unplanned downtime Can reduce maintenance costs by up to 25% and unplanned outages by 70% (GE Digital)
    Automated drilling performance tracking  Slow manual analysis of rig KPIs  Speeds up decision-making during drilling and improves safety 
    Remote monitoring of good conditions  Infrequent site visits, delayed issue detection  Supports real-time response and better resource allocation 
    AI-driven production forecasting  Inaccurate short-term forecasts, missed targets  Helps optimize lift strategies and resource planning 
    Digital permit to work systems  Paper-based HSE workflows  Improves compliance tracking and field audit readiness 


    Don’t select use cases solely on tech appeal. Even AI won’t work if there’s dirty data or your field staff can’t use it confidently.

    Step 4: Build a Phased Roadmap with Realistic Timelines

    Many digital transformation efforts in upstream oil and gas lose momentum because they try to do too much, too fast. Teams get overwhelmed, budgets stretch thin, and progress stalls. The solution? Break your roadmap into manageable phases, tied to clear business outcomes and operational maturity.

    Many upstream leaders leverage oil and gas industry consulting to design phased rollouts that reduce complexity and accelerate implementation.

    Here’s how to do it in practice.

    Consider your shortlist in Step 3. Don’t try to do it all immediately. Rather, classify each use case into one of three buckets:

    • Quick wins (low complexity and ready for piloting)
    • Mid-range initiatives (need integrations or cross-site collaboration)
    • Long-term bets (advanced analytics, AI, or full-scale automation)

    Suppose you begin with production reporting and asset monitoring:

    Phase  What happens  When 
    Test  Pilot asset condition monitoring on 3 pumps Month 1-3
    Expand  Roll out monitoring to 20+ pumps across fields Month 4-12 
    Integrate  Link monitoring with maintenance dispatch + alert automation  Month 13-24


    This strategy prevents your teams from getting tech-fatigued. Every victory wins over trust. And above all, it makes leadership visible, measurable value, nota  digital aspiration.

    Step 5: Monitor, Iterate, and Scale Across Assets

    Once your roadmap is in motion, don’t stop at rollout. You need to keep track of what’s working, fix what isn’t, and expand only what brings real results. This step is about building consistency, not complexity.

    • Regularly review KPIs to determine if targets are being achieved
    • Gather field feedback to identify adoption problems or technical holes
    • Enhance and evolve based on actual usage, not projections
    • Scale established solutions to comparable assets with aligned needs and infrastructure

    This keeps your roadmap current and expanding, rather than wasting time on tools that do not yield results.

    Conclusion

    Creating a digital roadmap for upstream oil and gas operations isn’t a matter of pursuing fads or purchasing more software. Effective use of oil and gas technology is less about adopting every new tool and more about applying the right tech in the right phase of field operations.

    It’s setting your sights on the right objectives, leveraging what you already have better, and deploying technology in a manner that your teams can realistically use and expand upon.

    This guide took you through every step:

    • How to set actual operational priorities
    • How to conduct an audit of your existing capability
    • How to select and deploy high-impact use cases
    • How to get it all done on the ground, over time

    But even the most excellent roadmap requires experience behind it, particularly when field realities, integration nuances, and production pressures are at play.

    That’s where SCSTech is.

    We’ve helped upstream teams design and implement digital strategies that don’t just look good on paper but deliver measurable value across assets, people, and workflows. From early audits to scaled deployments, our oil and gas industry consulting team knows how to align tech decisions with business outcomes.

    If you’re planning to move forward with a digital roadmap, talk to us at SCSTech. We can help you turn the right ideas into real, field-ready results.

  • Can RPA Work With Legacy Systems? Here’s What You Need to Know!

    Can RPA Work With Legacy Systems? Here’s What You Need to Know!

    It’s a question more IT leaders are asking as automation pressures rise and modernization budgets lag behind. 

    While robotic process automation (RPA) promises speed, scale, and relief from manual drudgery, most organizations aren’t operating in cloud-native environments. They’re still tied to legacy systems built decades ago and not exactly known for playing well with new tech.

    So, can RPA actually work with these older systems? Short answer: yes, but not without caveats. This article breaks down how RPA fits into legacy infrastructure, what gets in the way, and how smart implementation can turn technical debt into a scalable automation layer.

    Let’s get into it.

    Understanding the Compatibility Between RPA and Legacy Systems

    Legacy systems aren’t built for modern integration, but that’s exactly where RPA finds its edge. Unlike traditional automation tools that depend on APIs or backend access, RPA Services works through the user interface, mimicking human interactions with software. That means even if a system is decades old, closed off, or no longer vendor-supported, RPA can still operate on it, safely and effectively.

    This compatibility isn’t a workaround — it’s a deliberate strength. For companies running mainframes, terminal applications, or custom-built software, RPA offers a non-invasive way to automate without rewriting the entire infrastructure.

    How RPA Maintains Compatibility with Legacy Systems:

    • UI-Level Interaction: RPA tools replicate keyboard strokes, mouse clicks, and field entries, just like a human operator, regardless of how old or rigid the system is.
    • No Code-Level Dependencies: Since bots don’t rely on source code or APIs, they work even when backend integration isn’t possible.
    • Terminal Emulator Support: Most RPA platforms include support for green-screen mainframes (e.g., TN3270, VT100), enabling interaction with host-based systems.
    • OCR & Screen Scraping: For systems that don’t expose readable text, bots can use optical character recognition (OCR) to extract and process data.
    • Low-Risk Deployment: Because RPA doesn’t alter the underlying system, it poses minimal risk to legacy environments and doesn’t interfere with compliance.

    Common Challenges When Connecting RPA to Legacy Environments

    While RPA is compatible with most legacy systems on the surface, getting it to perform consistently at scale isn’t always straightforward. Legacy environments come with quirks — from unpredictable interfaces to tight access restrictions — that can compromise bot reliability and performance if not accounted for early.

    Some of the most common challenges include:

    1. Unstable or Inconsistent Interfaces

    Legacy systems often lack UI standards. A small visual change — like a shifted field or updated window — can break bot workflows. Since RPA depends on pixel- or coordinate-level recognition in these cases, any visual inconsistency can cause the automation to fail silently.

    2. Limited Access or Documentation

    Many legacy platforms have little-to-no technical documentation. Access might be locked behind outdated security protocols or hardcoded user roles. This makes initial configuration and bot design harder, especially when developers need to reverse-engineer interface logic without support from the original vendor.

    3. Latency and Response Time Issues

    Older systems may not respond at consistent speeds. RPA bots, which operate on defined wait times or expected response behavior, can get tripped up by delays, resulting in skipped steps, premature entries, or incorrect reads.

    Advanced RPA platforms allow dynamic wait conditions (e.g., “wait until this field appears”) rather than fixed timers.

    4. Citrix or Remote Desktop Environments

    Some legacy apps are hosted on Citrix or RDP setups where bots don’t “see” elements the same way they would on local machines. This forces developers to rely on image recognition or OCR, which are more fragile and require constant calibration.

    5. Security and Compliance Constraints

    Many legacy systems are tied into regulated environments — banking, utilities, government — where change control is strict. Even though RPA is non-invasive, introducing bots may still require IT governance reviews, user credential rules, and audit trails to pass compliance.

    Best Practices for Implementing RPA with Legacy Systems

    Best Practices for Successful RPA in Legacy Systems

    Implementing RPA Development Services in a legacy environment is not plug-and-play. While modern RPA platforms are built to adapt, success still depends on how well you prepare the environment, design the workflows, and choose the right processes.

    Here are the most critical best practices:

    1. Start with High-Volume, Rule-Based Tasks

    Legacy systems often run mission-critical functions. Instead of starting with core processes, begin with non-invasive, rule-driven workflows like:

    • Data extraction from mainframe screens
    • Invoice entry or reconciliation
    • Batch report generation

    These use cases deliver ROI fast and avoid touching business logic, minimizing risk. 

    2. Use Object-Based Automation Where Possible

    When dealing with older apps, UI selectors (object-based interactions) are more stable than image recognition. But not all legacy systems expose selectors. Identify which parts of the system support object detection and prioritize automations there.

    Tools like UiPath and Blue Prism offer hybrid modes (object + image) — use them strategically to improve reliability.

    3. Build In Exception Handling and Logging from Day One

    Legacy systems can behave unpredictably — failed logins, unexpected pop-ups, or slow responses are common. RPA bots should be designed with:

    • Try/catch blocks for known failures
    • Timeouts and retries for latency
    • Detailed logging for root-cause analysis

    Without this, bot failures may go undetected, leading to invisible operational errors — a major risk in high-compliance environments.

    4. Mirror the Human Workflow First — Then Optimize

    Start by replicating how a human would perform the task in the legacy system. This ensures functional parity and easier stakeholder validation. Once stable, optimize:

    • Reduce screen-switches
    • Automate parallel steps
    • Add validations that the system lacks

    This phased approach avoids early overengineering and builds trust in automation.

    5. Test in Production-Like Environments

    Testing legacy automation in a sandbox that doesn’t behave like production is a common failure point. Use a cloned environment with real data or test after hours in production with read-only roles, if available.

    Legacy UIs often behave differently depending on screen resolution, load, or session type — catch this early before scaling.

    6. Secure Credentials with Vaults or IAM

    Hardcoding credentials for bots in legacy systems is a major compliance red flag. Use:

    • RPA-native credential vaults (e.g., CyberArk integrations)
    • Role-based access controls
    • Scheduled re-authentication policies

    This reduces security risk while keeping audit logs clean for governance teams.

    7. Loop in IT, Not Just Business Teams

    Legacy systems are often undocumented or supported by a single internal team. Avoid shadow automation. Work with IT early to:

    • Map workflows accurately
    • Get access permissions
    • Understand system limitations

    Collaboration here prevents automation from becoming brittle or blocked post-deployment.

    RPA in legacy environments is less about brute-force automation and more about thoughtful design under constraint. Build with the assumption that things will break — and then build workflows that recover fast, log clearly, and scale without manual patchwork.

    Is RPA a Long-Term Solution for Legacy Systems?

    Yes, but only when used strategically. 

    RPA isn’t a forever fix for legacy systems, but it is a durable bridge, one that buys time, improves efficiency, and reduces operational friction while companies modernize at their own pace.

    For utility, finance, and logistics firms still dependent on legacy environments, RPA offers years of viable value when:

    • Deployed with resilience and security in mind
    • Designed around the system’s constraints, not against them
    • Scaled through a clear governance model

    However, RPA won’t modernize the core, it enhances what already exists. For long-term ROI, companies must pair automation with a roadmap that includes modernization or system transformation in parallel.

    This is where SCSTech steps in. We don’t treat robotic process automation as a tool; we approach it as a tactical asset inside larger modernization strategy. Whether you’re working with green-screen terminals, aging ERP modules, or disconnected data silos, our team helps you implement automation that’s reliable now, but aligned with where your infrastructure needs to go.

  • The ROI of Sensor-Driven Asset Health Monitoring in Midstream Operations

    The ROI of Sensor-Driven Asset Health Monitoring in Midstream Operations

    In midstream, a single asset failure can halt operations and burn through hundreds of thousands in downtime and emergency response.

    Yet many operators still rely on time-based checks and manual inspections — methods that often catch problems too late, or not at all.

    Sensor-driven asset health monitoring flips the model. With real-time data from embedded sensors, teams can detect early signs of wear, trigger predictive maintenance, and avoid costly surprises. 

    This article unpacks how that visibility translates into real, measurable ROI. This article unpacks how that visibility translates into real, measurable ROI, especially when paired with oil and gas technology solutions designed to perform in high-risk, midstream environments.

    What Is Sensor-Driven Asset Health Monitoring in Midstream?

    In midstream operations — pipelines, storage terminals, compressor stations — asset reliability is everything. A single pressure drop, an undetected leak, or delayed maintenance can create ripple effects across the supply chain. That’s why more midstream operators are turning to sensor-driven asset health monitoring.

    At its core, this approach uses a network of IoT-enabled sensors embedded across critical assets to track their condition in real time. It’s not just about reactive alarms. These sensors continuously feed data on:

    • Pressure and flow rates
    • Temperature fluctuations
    • Vibration and acoustic signals
    • Corrosion levels and pipeline integrity
    • Valve performance and pump health

    What makes this sensor-driven model distinct is the continuous diagnostics layer it enables. Instead of relying on fixed inspection schedules or manual checks, operators gain a live feed of asset health, supported by analytics and thresholds that signal risk before failure occurs.

    In midstream, where the scale is vast and downtime is expensive, this shift from interval-based monitoring to real-time condition-based oversight isn’t just a tech upgrade — it’s a performance strategy.

    Sensor data becomes the foundation for:

    • Predictive maintenance triggers
    • Remote diagnostics
    • Failure pattern analysis
    • And most importantly, operational decisions grounded in actual equipment behavior

    The result? Fewer surprises, better safety margins, and a stronger position to quantify asset reliability — something we’ll dig into when talking ROI.

    Key Challenges in Midstream Asset Management Without Sensors

    Risk Without Sensor-Driven Monitoring

    Without sensor-driven monitoring, midstream operators are often flying blind across large, distributed, high-risk systems. Traditional asset management approaches — grounded in manual inspections, periodic maintenance, and lagging indicators — come with structural limitations that directly impact reliability, cost control, and safety.

    Here’s a breakdown of the core challenges:

    1. Delayed Fault Detection

    Without embedded sensors, operators depend on scheduled checks or human observation to identify problems.

    • Leaks, pressure drops, or abnormal vibrations can go unnoticed for hours — sometimes days — between inspections.
    • Many issues only become visible after performance degrades or equipment fails, resulting in emergency shutdowns or unplanned outages.

    2. Inability to Track Degradation Trends Over Time

    Manual inspections are episodic. They provide snapshots, not timelines.

    • A technician may detect corrosion or reduced valve responsiveness during a routine check, but there’s no continuity to know how fast the degradation is occurring or how long it’s been developing.
    • This makes it nearly impossible to predict failures or plan proactive interventions.

    3. High Cost of Unplanned Downtime

    In midstream, pipeline throughput, compression, and storage flow must stay uninterrupted.

    • An unexpected pump failure or pipe leak doesn’t just stall one site — it disrupts the supply chain across upstream and downstream operations.
    • Emergency repairs are significantly more expensive than scheduled interventions and often require rerouting or temporary shutdowns.

    A single failure event can cost hundreds of thousands in downtime, not including environmental penalties or lost product.

    4. Limited Visibility Across Remote or Hard-to-Access Assets

    Midstream infrastructure often spans hundreds of miles, with many assets located underground, underwater, or in remote terrain.

    • Manual inspections of these sites are time-intensive and subject to environmental and logistical delays.
    • Data from these assets is often sparse or outdated by the time it’s collected and reported.

    Critical assets remain unmonitored between site visits — a major vulnerability for high-risk assets.

    5. Regulatory and Reporting Gaps

    Environmental and safety regulations demand consistent documentation of asset integrity, especially around leaks, emissions, and spill risks.

    • Without sensor data, reporting is dependent on human records, often inconsistent and subject to audits.
    • Missed anomalies or delayed documentation can result in non-compliance fines or reputational damage.

    Lack of real-time data makes regulatory defensibility weak, especially during incident investigations.

    6. Labor Dependency and Expertise Gaps

    A manual-first model heavily relies on experienced field technicians to detect subtle signs of wear or failure.

    • As experienced personnel retire and talent pipelines shrink, this approach becomes unsustainable.
    • Newer technicians lack historical insight, and without sensors, there’s no system to bridge the knowledge gap.

    Reliability becomes person-dependent instead of system-dependent.

    Without system-level visibility, operators lack the actionable insights provided by modern oil and gas technology solutions, which creates a reactive, risk-heavy environment.

    This is exactly where sensor-driven monitoring begins to shift the balance, from exposure to control.

    Calculating ROI from Sensor-Driven Monitoring Systems

    For midstream operators, investing in sensor-driven asset health monitoring isn’t just a tech upgrade — it’s a measurable business case. The return on investment (ROI) stems from one core advantage: catching failures before they cascade into costs.

    Here’s how the ROI typically stacks up, based on real operational variables:

    1. Reduced Unplanned Downtime

    Let’s start with the cost of a midstream asset failure.

    • A compressor station failure can cost anywhere from $50,000 to $300,000 per day in lost throughput and emergency response.
    • With real-time vibration or pressure anomaly detection, sensor systems can flag degradation days before failure, enabling scheduled maintenance.

    If even one major outage is prevented per year, the sensor system often pays for itself multiple times over.

    2. Optimized Maintenance Scheduling

    Traditional maintenance is either time-based (replace parts every X months) or fail-based (fix it when it breaks). Both are inefficient.

    • Sensors enable condition-based maintenance (CBM) — replacing components when wear indicators show real need.
    • This avoids early replacement of healthy equipment and extends asset life.

    Lower maintenance labor hours, fewer replacement parts, and less downtime during maintenance windows.

    3. Fewer Compliance Violations and Penalties

    Sensor-driven monitoring improves documentation and reporting accuracy.

    • Leak detection systems, for example, can log time-stamped emissions data, critical for EPA and PHMSA audits.
    • Real-time alerts also reduce the window for unnoticed environmental releases.

    Avoidance of fines (which can exceed $100,000 per incident) and a stronger compliance posture during inspections.

    4. Lower Insurance and Risk Exposure

    Demonstrating that assets are continuously monitored and failures are mitigated proactively can:

    • Reduce risk premiums for asset insurance and liability coverage
    • Strengthen underwriting positions in facility risk models

    Lower annual risk-related costs and better positioning with insurers.

    5. Scalability Without Proportional Headcount

    Sensors and dashboards allow one centralized team to monitor hundreds of assets across vast geographies.

    • This reduces the need for site visits, on-foot inspections, and local diagnostic teams.
    • It also makes asset management scalable without linear increases in staffing costs.

    Bringing it together:

    Most midstream operators using sensor-based systems calculate ROI in 3–5 operational categories. Here’s a simplified example:

    ROI Area Annual Savings Estimate
    Prevented Downtime (1 event) $200,000
    Optimized Maintenance $70,000
    Compliance Penalty Avoidance $50,000
    Reduced Field Labor $30,000
    Total Annual Value $350,000
    System Cost (Year 1) $120,000
    First-Year ROI ~192%


    Over 3–5 years, ROI improves as systems become part of broader operational workflows, especially when data integration feeds into predictive analytics and enterprise decision-making.

    ROI isn’t hypothetical anymore. With real-time condition data, the economic case for sensor-driven monitoring becomes quantifiable, defensible, and scalable.

    Conclusion

    Sensor-driven monitoring isn’t just a nice-to-have — it’s a proven way for midstream operators to cut downtime, reduce maintenance waste, and stay ahead of failures. With the right data in hand, teams stop reacting and start optimizing.

    SCSTech helps you get there. Our digital oil and gas technology solutions are built for real-world midstream conditions — remote assets, high-pressure systems, and zero-margin-for-error operations.

    If you’re ready to make reliability measurable, SCSTech delivers the technical foundation to do it.

  • How AgTech Startups Use GIS to Optimize Irrigation and Crop Planning

    How AgTech Startups Use GIS to Optimize Irrigation and Crop Planning

    Farming isn’t uniform. In the evolving landscape of agriculture & technology, soil properties, moisture levels, and crop needs can change dramatically within meters — yet many irrigation strategies still treat fields as a single, homogenous unit.

    GIS (Geographic Information Systems) offers precise, location-based insights by layering data on soil texture, elevation, moisture, and crop growth stages. This spatial intelligence lets AgTech startups move beyond blanket irrigation to targeted water management.

    By integrating GIS with sensor data and weather models, startups can tailor irrigation schedules and volumes to the specific needs of micro-zones within a field. This approach reduces inefficiencies, helps conserve water, and supports consistent crop performance.

    Importance of GIS in Agriculture for Irrigation and Crop Planning

    Agriculture isn’t just about managing land. It’s about managing variation. Soil properties shift within a few meters. Rainfall patterns change across seasons. Crop requirements differ from one field to the next. Making decisions based on averages or intuition leads to wasted water, underperforming yields, and avoidable losses.

    GIS (Geographic Information Systems) is how AgTech startups leverage agriculture & technology innovations to turn this variability into a strategic advantage.

    GIS gives a spatial lens to data that was once trapped in spreadsheets or siloed systems. With it, agri-tech innovators can:

    • Map field-level differences in soil moisture, slope, texture, and organic content — not as general trends but as precise, geo-tagged layers.
    • Align irrigation strategies with crop needs, landform behavior, and localized weather forecasts.
    • Support real-time decision-making, where planting windows, water inputs, and fertilizer applications are all tailored to micro-zone conditions.

    To put it simply: GIS enables location-aware farming. And in irrigation or crop planning, location is everything.

    A one-size-fits-all approach may lead to 20–40% water overuse in certain regions and simultaneous under-irrigation in others. By contrast, GIS-backed systems can reduce water waste by up to 30% while improving crop yield consistency, especially in water-scarce zones.

    GIS Data Layers Used for Irrigation and Crop Decision-Making

    GIS Data Layers Powering Smarter Irrigation and Crop Planning

    The power of GIS lies in its ability to stack different data layers — each representing a unique aspect of the land — into a single, interpretable visual model. For AgTech startups focused on irrigation and crop planning, these layers are the building blocks of smarter, site-specific decisions.

    Let’s break down the most critical GIS layers used in precision agriculture:

    1. Soil Type and Texture Maps

    • Determines water retention, percolation rate, and root-zone depth
    • Clay-rich soils retain water longer, while sandy soils drain quickly
    • GIS helps segment fields into soil zones so that irrigation scheduling aligns with water-holding capacity

    Irrigation plans that ignore soil texture can lead to overwatering on heavy soils and water stress on sandy patches — both of which hurt yield and resource efficiency.

    2. Slope and Elevation Models (DEM – Digital Elevation Models)

    • Identifies water flow direction, runoff risk, and erosion-prone zones
    • Helps calculate irrigation pressure zones and place contour-based systems effectively
    • Allows startups to design variable-rate irrigation plans, minimizing water pooling or wastage in low-lying areas

    3. Soil Moisture and Temperature Data (Often IoT Sensor-Integrated)

    • Real-time or periodic mapping of subsurface moisture levels powered by artificial intelligence in agriculture
    • GIS integrates this with surface temperature maps to detect drought stress or optimal planting windows

    Combining moisture maps with evapotranspiration models allows startups to trigger irrigation only when thresholds are crossed, avoiding fixed schedules.

    4. Crop Type and Growth Stage Maps

    • Uses satellite imagery or drone-captured NDVI (Normalized Difference Vegetation Index)
    • Tracks vegetation health, chlorophyll levels, and biomass variability across zones
    • Helps match irrigation volume to crop growth phase — seedlings vs. fruiting stages have vastly different needs

    Ensures water is applied where it’s needed most, reducing waste and improving uniformity.

    5. Historical Yield and Input Application Maps

    • Maps previous harvest outcomes, fertilizer applications, and pest outbreaks
    • Allows startups to overlay these with current-year conditions to forecast input ROI

    GIS can recommend crop shifts or irrigation changes based on proven success/failure patterns across zones.

    By combining these data layers, GIS creates a 360° field intelligence system — one that doesn’t just react to soil or weather, but anticipates needs based on real-world variability.

    How GIS Helps Optimize Irrigation in Farmlands

    Optimizing irrigation isn’t about simply adding more sensors or automating pumps. It’s about understanding where, when, and how much water each zone of a farm truly needs — and GIS is the system that makes that intelligence operational.

    Here’s how AgTech startups are using GIS to drive precision irrigation in real, measurable steps:

    1. Zoning Farmlands Based on Hydrological Behavior

    Using GIS, farmlands are divided into irrigation management zones by analyzing soil texture, slope, and historical moisture retention.

    • High clay zones may need less frequent, deeper irrigation
    • Sandy zones may require shorter, more frequent cycles
    • GIS maps these zones down to a 10m x 10m (or even finer) resolution, enabling differentiated irrigation logic per zone

    Irrigation plans stop being uniform. Instead, water delivery matches the absorption and retention profile of each micro-zone.

    2. Integrating Real-Time Weather and Evapotranspiration Data

    GIS platforms integrate satellite weather feeds and localized evapotranspiration (ET) models — which calculate how much water a crop is losing daily due to heat and wind.

    • The system then compares ET rates with real-time soil moisture data
    • When depletion crosses a set threshold (say, 50% of field capacity), GIS triggers or recommends irrigation — tailored by zone

    3. Automating Variable Rate Irrigation (VRI) Execution

    AgTech startups link GIS outputs directly with VRI-enabled irrigation systems (e.g., pivot systems or drip controllers).

    • Each zone receives a customized flow rate and timing
    • GIS controls or informs nozzles and emitters to adjust water volume on the move
    • Even during a single irrigation pass, systems adjust based on mapped need levels

    4. Detecting and Correcting Irrigation Inefficiencies

    GIS helps track where irrigation is underperforming due to:

    • Blocked emitters or leaks
    • Pressure inconsistencies
    • Poor infiltration zones

    By overlaying actual soil moisture maps with intended irrigation plans, GIS identifies deviations — sometimes in near real-time.

    Alerts are sent to field teams or automated systems to adjust flow rates, fix hardware, or reconfigure irrigation maps.

    5. Enabling Predictive Irrigation Based on Crop Stage and Forecasts

    GIS tools layer crop phenology models (growth stage timelines) with weather forecasts.

    • For example, during flowering stages, water demand may spike 30–50% for many crops.
    • GIS platforms model upcoming rainfall and temperature shifts, helping plan just-in-time irrigation events before stress sets in.

    Instead of reactive watering, farmers move into data-backed anticipation — a fundamental shift in irrigation management.

    GIS transforms irrigation from a fixed routine into a dynamic, responsive system — one that reacts to both the land’s condition and what’s coming next. AgTech startups that embed GIS into their irrigation stack aren’t just conserving water; they’re building systems that scale intelligently with environmental complexity.

    Conclusion

    GIS is no longer optional in modern agriculture & technology — it’s how AgTech startups bring precision to irrigation and crop planning. From mapping soil zones to triggering irrigation based on real-time weather and crop needs, GIS turns field variability into a strategic advantage.

    But precision only works if your data flows into action. That’s where SCSTech comes in. Our GIS solutions help AgTech teams move from scattered data to clear, usable insights, powering smarter irrigation models and crop plans that adapt to real-world conditions.