Tag: GIS Mapping

  • How Enterprise GIS Optimizes Utility Networks & Reduces Energy Losses

    How Enterprise GIS Optimizes Utility Networks & Reduces Energy Losses

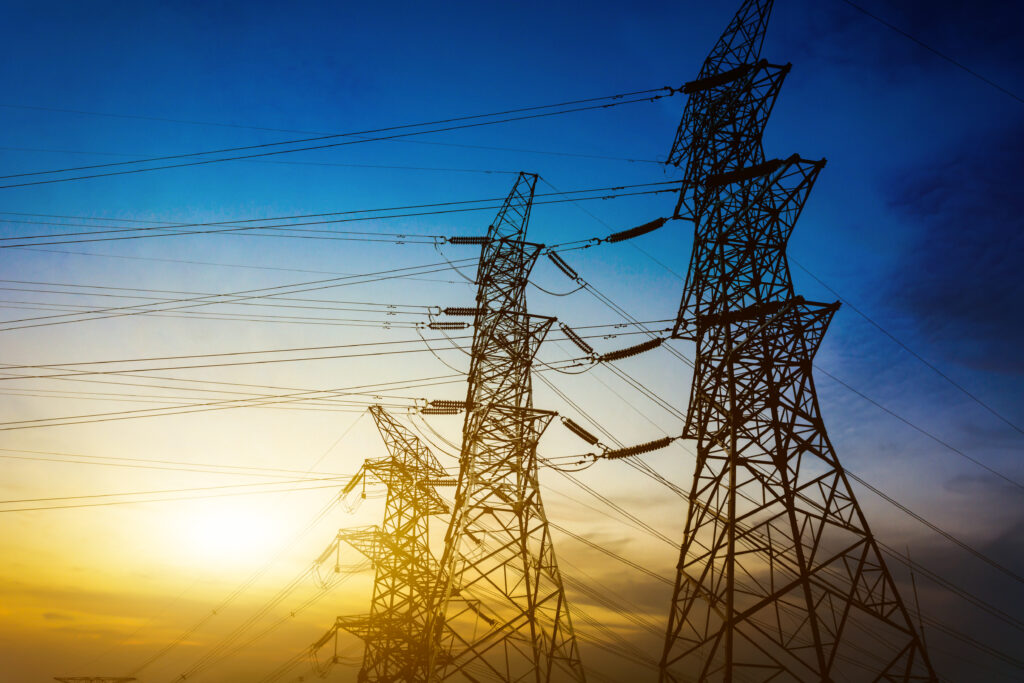
    What you cannot see, you cannot save in the utility sector. Power distribution companies have struggled with a frustrating reality for decades. They pump massive amounts of electricity into the grid, but a large percentage disappears before it ever reaches the customer’s meter. These are known as Aggregate Technical and Commercial (AT&C) losses, and they bleed millions of dollars from the economy every single year.

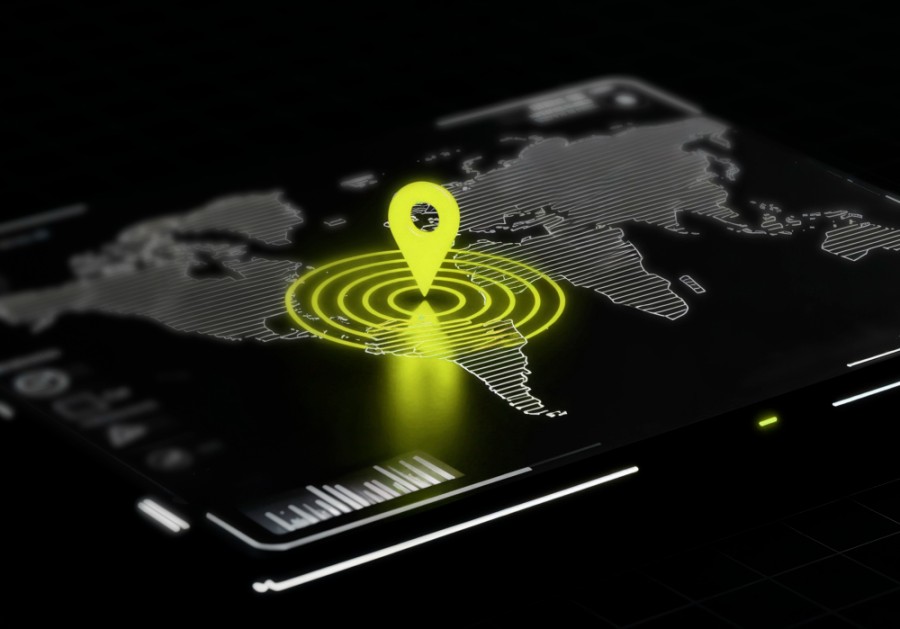
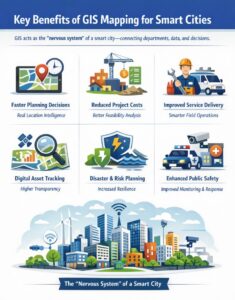
    While the industry has traditionally relied on SCADA systems and basic spreadsheets, a quiet revolution is underway in control rooms. Enterprise GIS (Geographic Information Systems) has moved beyond simple digital maps. They have become the central nervous system of modern utility networks. They offer a way to see, analyze, and fix leaks in the grid (literal and financial). When organizations search for the best GIS company in Mumbai, they look for exactly this capability: a partner that understands how GIS for utilities transforms chaotic asset data into actionable intelligence.

    The Blind Spot of Traditional Network Management

    Enterprise GIS

    To understand how GIS fixes losses, we have to understand why utilities lose power in the first place. The reasons usually fall into two categories. First, there are technical losses. These are the natural resistances in wires and transformers that convert electrical energy into heat. Second, there are commercial losses. These are theft, faulty meters, billing errors, or simply incorrect records of who lives where.

    Here is the dirty secret that most utility managers will admit over coffee: Most companies do not know exactly where their assets are.

    When your asset data is wrong, your loss calculation is also wrong. Enterprise GIS solves this by creating a single source of truth. It tells the engineer exactly how long a cable is (so you can calculate expected technical loss) and which customers are connected to which transformer (so you can spot theft immediately). This is the foundation of any serious utility network optimization strategy.

    Moving from Static Maps to Dynamic Intelligence

    A standard digital map is only a picture. Enterprise GIS is a database that happens to look like a map.

    When you optimize a utility network with GIS, you are essentially building a digital twin of the entire grid. Every pole, every transformer, every switch, and every meter gets a unique ID. Even a precise location. But the magic does not stop with the hardware. You can layer in customer data, consumption history, and real-time sensor feeds.

    Consider the problem of feeder balancing. You will see one transformer groaning under the weight of a hundred illegal hookups, while the transformer two blocks away sits idle. That imbalance creates massive technical losses because the overloaded transformer runs hot.

    With Enterprise GIS, a planner can open a dashboard that color-codes every transformer based on its load. Red means overloaded, and blue means underutilized. The software can actually suggest optimal re-routing of lines to balance the load. You do not have to guess anymore. You only follow the data.

    The Battle Against Power Theft

    Let us talk about the elephant in the room: commercial losses due to theft.

    Power theft is a systemic problem in many developing economies. The traditional method of finding theft is reactive. An officer notices a neighborhood is dimly lit, but the meter shows zero consumption, or a neighbor snitches.

    Enterprise GIS changes the game through connectivity tracing. Here is how power theft detection using GIS actually works: 

    • The system knows exactly which households should be connected to a specific distribution transformer. 
    • It pulls the billing data for that transformer and compares the total energy supplied to the sum of the bills paid.
    • If the math does not add up, the GIS highlights that transformer cluster as a “high-loss zone.” Now, instead of searching the whole city, the enforcement team knows exactly which four streets to inspect. 
    • Some advanced implementations even integrate with drone imagery. 
    • The GIS overlays thermal images of rooftops with the digital asset map. 
    • If the GIS says there is no legal meter at a location, but the thermal image shows a hot cable running into the building, that is a warrant.
    • This targeted approach turns loss reduction from a guessing game into a surgical strike.

    Improving Response Times and Reducing “Idle Losses”

    There is another type of loss that does not appear in textbooks but shows up on balance sheets: the loss caused by slow response times.

    When a feeder trips in a non-GIS environment, the control room gets a call. They pull out a physical map. They argue about whose jurisdiction the fault falls under. They dispatch a crew. The crew gets lost. All the while, the line is dead, and power is not flowing to paying customers. That downtime is a revenue loss.

    The moment the sensor trips, the location pops up on the screen in a GIS-enabled network. The system automatically identifies the nearest crew, routes them around traffic jams, and sends the asset history to their tablet before they even leave the yard. The crew fixes the fault in forty-five minutes instead of four hours.

    When you multiply those time savings across hundreds of outages per year, the amount of “energy not served” drops significantly. You are not just saving wires; you are saving time, which in this business is exactly the same as saving kilowatt-hours.

    Steps to Implementation

    If a utility wants to move from loss-making to profit-making, implementing Enterprise GIS is not optional anymore. But throwing software at the problem does not work. You need a workflow.

    First, you need a field survey. You cannot digitize bad paper maps. You have to send a team with GPS devices to verify the latitude and longitude of every asset. It is tedious, but it is the foundation.

    Second, you need integration. The GIS cannot sit in a silo. It has to talk to your billing system (ERP) and your outage management system (OMS). When finance and engineering look at the same data, magic happens.

    Finally, you need mobile access. The line worker in the rain needs to see the map on a ruggedized tablet. If the data is locked in the head office, it is useless.

    Final Thoughts

    Energy losses are not a mystery. They are a measurement problem. For decades, utilities have been flying blind, relying on gut instinct and outdated records. Enterprise GIS pulls back the curtain.

    It shows you exactly where your copper is, how hard it is working, and who is taking power without paying for it. It allows a utility to reduce technical losses through better load balancing and reduce commercial losses through targeted enforcement.

    GIS is the most effective loss reduction technique you can implement. The technology exists. The data is waiting. The only question left is: how long can you afford to stay in the dark? Contact SCS Tech India if you want to set up the most reliable GIS solution. 

    FAQs

    1. Can GIS detect power theft?

    Yes. Power theft detection using GIS works through connectivity tracing. The system compares energy supplied to a transformer cluster against the sum of billed consumption from mapped consumers. A significant mismatch indicates potential theft or unauthorized connections. GIS can also integrate with thermal drone imagery to identify illegal hookups visually. This transforms theft detection from random inspection to targeted enforcement.

    1. How does GIS help reduce technical losses in power distribution?

    Enterprise GIS can reduce technical losses by enabling precise network modeling and load flow analysis. It identifies overloaded transformers, unbalanced feeders, and inefficient power flow paths. With accurate geospatial data, utilities can reconfigure networks, optimize voltage levels, and reduce heat losses caused by overloading or long distribution lines. This is a core component of utility network optimization.

    1. How much energy loss can GIS realistically save?

    Independent case studies from utilities implementing enterprise GIS show AT&C loss reduction of 3% to 8% within 12 to 18 months. The exact savings depend on baseline loss levels, quality of field data collection, and integration with billing systems. Utilities starting with losses above 20% often see the fastest return on investment. 

    1. Can GIS integrate with existing billing and SCADA systems?

    Yes. Modern enterprise GIS platforms offer APIs and middleware to integrate with most billing systems (ERP, SAP, Oracle) and SCADA platforms. This integration ensures that consumer data, financial records, and real-time sensor feeds all align on a single geospatial dashboard. Without this integration, GIS for utilities loses much of its loss-reduction potential.

  • GIS Mapping: 9 Use Cases That Are Powering Smart Cities & Infrastructure

    GIS Mapping: 9 Use Cases That Are Powering Smart Cities & Infrastructure

    Smart cities are no longer futuristic ideas as they are actively being designed, funded, and built across India. With rapid urban growth, rising infrastructure demand, and increasing pressure on resources, city planners and government agencies need smarter ways to manage land, water, transport, public services, and emergency response. This is where GIS mapping (Geographic Information Systems) has become a game-changer.

    GIS mapping is more than just digital maps. It enables decision-makers to visualize real-world data geographically, analyze patterns, forecast risks, and plan smarter infrastructure development. Whether a city is planning new roads, managing flood-prone zones, tracking public assets, or improving traffic flow, GIS provides a single, powerful layer of intelligence that connects everything.

    In this blog, we’ll explore what GIS mapping is, why it’s essential for smart cities, and the most high-impact GIS use cases that are transforming infrastructure and urban planning in 2026.

    What Is GIS Mapping and Why Does It Matter Today?

    GIS mapping is a technology that collects, stores, analyzes, and visualizes geographical or location-based data. It combines traditional mapping with modern data analytics, enabling organizations to answer key questions like:

    Where are the problems occurring?

    Why are they happening in specific locations?

    What areas are most vulnerable in the future?

    How can we optimize infrastructure planning and public service delivery?

    In simple terms: GIS turns location data into actionable intelligence.

    For smart cities, GIS is essential because every urban system—roads, water pipelines, electricity networks, traffic signals, public safety, waste management—exists in a geographic space. GIS helps connect these systems and manage them more efficiently.

    How GIS Mapping Powers Smart City Development

    GIS mapping serves as the technological backbone of smart city development by synthesizing diverse, real-time data into a unified, actionable framework. By integrating layers such as transportation networks, land usage, and population distribution with critical utility infrastructure and environmental metrics, GIS allows urban planners to move beyond departmental silos.

    This multidimensional approach—further enriched by satellite and drone imagery—transforms the city into a visible, dynamic ecosystem where the relationship between streetlights, air quality, and traffic flow can be analyzed simultaneously. Ultimately, this geographic intelligence empowers leaders to make precise, data-driven decisions that improve efficiency and quality of life across the entire urban landscape.

    Top 9 GIS Mapping Use Cases Powering Smart Cities & Infrastructure

    Let’s look at the most impactful and practical GIS applications being used in smart cities and infrastructure projects today.

    1. Urban Planning and Land Use Management

    Urban development requires structured planning—where to build, what to build, and how to ensure long-term sustainability. GIS helps planners identify growth patterns, land availability, and development constraints.

    GIS enables:

    • Zoning and land-use planning

    • Master planning for city expansion

    • Identifying suitable land parcels for public projects

    • Mapping unauthorized constructions and encroachments

    • Impact analysis of new infrastructure projects

    Instead of relying on static reports, smart city planners can visualize development scenarios using interactive GIS dashboards.

    2. Smart Transportation and Traffic Management

    Traffic congestion is one of the biggest challenges in urban India. Smart mobility depends on analyzing traffic flow, identifying bottlenecks, and optimizing routes for both private and public transport.

    With GIS mapping, authorities can:

    • Monitor congestion hotspots

    • Analyze accident-prone zones

    • Optimize traffic signals and junction layouts

    • Plan alternate routes and bypass corridors

    • Improve public transport route planning

    Over time, GIS can also support long-term initiatives such as integrated metro, bus, and multimodal transport networks by improving planning accuracy.

    3. Asset Management for Public Infrastructure

    Smart cities run on public assets: streetlights, water valves, power transformers, CCTV cameras, roads, bridges, signboards, and more. Managing these assets manually is costly and inefficient.

    GIS-based asset mapping helps governments and civic bodies:

    • Create an accurate inventory of city assets

    • Track asset condition and maintenance schedules

    • Identify asset gaps across regions

    • Reduce service downtime through faster repairs

    • Improve accountability through geo-tagged records

    This is one of the most practical and high-ROI uses of GIS, especially for municipal bodies focused on service delivery improvements.

    4. Water Supply and Pipeline Network Monitoring

    Water is one of the most critical—and stressed—resources for growing cities. Leakage, illegal connections, and poor monitoring can lead to heavy losses and supply disruption.

    GIS helps utilities manage water networks by enabling:

    • Mapping of pipeline networks and distribution zones

    • Leak detection and hotspot identification

    • Monitoring pressure zones and flow rates

    • Planning new water lines based on demand mapping

    • Visualizing real-time supply status across regions

    When integrated with IoT sensors, GIS becomes even more powerful, enabling real-time alerts and predictive maintenance.

    5. Disaster Management and Emergency Response

    Whether it’s floods, landslides, fires, earthquakes, or industrial incidents, emergency response depends on speed and accurate situational awareness. GIS enables authorities to respond faster and allocate resources efficiently.

    GIS can support:

    • Flood risk mapping and drainage analysis

    • Identifying evacuation routes and shelter locations

    • Real-time incident mapping and resource allocation

    • Tracking emergency vehicles and field teams

    • Monitoring disaster impact zones using satellite imagery

    This makes GIS an essential tool not only for smart cities but also for climate resilience planning.

    6. Solid Waste Management and Sanitation Planning

    Solid waste management is a major operational challenge in cities. Routes must be optimized, bins must be tracked, and collection schedules need to be managed efficiently.

    GIS helps by enabling:

    • Geo-tagging of bins and collection points

    • Route optimization for waste collection vehicles

    • Identifying missed pickups or underserved areas

    • Planning landfill sites and waste transfer stations

    • Monitoring sanitation performance across zones

    This use case supports cleaner cities while reducing fuel consumption and operational costs.

    7. Smart Street Lighting and Energy Optimization

    Street lighting is one of the biggest municipal electricity expenses. Smart street lighting projects are powered by GIS through mapping and monitoring of lighting infrastructure.

    GIS supports:

    • Mapping existing streetlight points

    • Identifying high-need areas (dark spots)

    • Monitoring faults and maintenance schedules

    • Optimizing energy usage through smart controls

    This results in improved public safety while keeping energy spending under control.

    8. Environmental Monitoring and Sustainability Projects

    Smart cities must also be sustainable cities. GIS plays a vital role in monitoring environmental conditions and planning eco-friendly interventions.

    Common GIS applications include:

    • Air quality mapping and pollution hotspot tracking

    • Mapping green spaces and urban forest projects

    • Heat map analysis for urban heat islands

    • Water body monitoring and restoration planning

    • Noise pollution and waste dumping monitoring

    These insights help cities plan long-term environmental action instead of reactive measures.

    9. Smart Governance and Citizen Service Delivery

    Citizens expect fast, transparent, and efficient service delivery. GIS enables governance teams to manage issues geographically and improve response times.

    With GIS-enabled citizen service models, authorities can:

    • Map citizen complaints by ward/zone

    • Prioritize areas with high service gaps

    • Allocate field teams efficiently

    • Track service completion with geo-tagged proof

    • Improve accountability with data-based monitoring

    This leads to better citizen satisfaction and measurable improvements in municipal services.

    Key Benefits of GIS Mapping for Smart Cities

    GIS brings value across planning, operations, and governance. Some of the most powerful benefits include:

    Key benefits of GIS mapping for smart cities including planning, cost reduction, resilience and public safety

    Wrapping Up!

    GIS mapping is no longer just a support tool—it has become a foundational technology driving smart city development and modern infrastructure planning. In 2026, cities that adopt GIS effectively gain a major advantage: they can plan smarter, respond faster, allocate resources efficiently, and deliver better public services.

    From transport and water management to disaster response and sustainability initiatives, GIS is empowering governments and enterprises to transform how cities function—making them more connected, resilient, and future-ready.

    For organizations working on smart city projects, partnering with a technology provider like SCS Tech India that understands GIS implementation at scale can make all the difference. With the right strategy, data systems, and deployment approach, GIS can become one of the highest-impact investments for infrastructure modernization.