Ever wondered why so many IT projects run over time or exceed budgets? Even with talented teams and modern tools, delays are surprisingly common and the consequences can be costly. Late delivery can mean lost revenue, missed market opportunities, and frustrated stakeholders.
The truth is, most IT project delays are predictable. For IT companies in Mumbai, understanding the common pitfalls and taking proactive steps can help keep projects on track, deliver value faster, and reduce stress for teams.
Why IT Projects Get Delayed: An Overview
Research shows that a significant share of IT and technology projects struggle with time and budget. In one analysis of 1,355 public-sector IT projects, the average project ran 24% longer than planned.
According to a global BCG survey, nearly 50% of respondents reported that more than 30% of their organization’s tech projects are delayed or go over budget.
For large-scale initiatives, even moderate overruns can result in millions in lost productivity or missed opportunities.
Some key factors behind these delays include:
- Unrealistic timelines – Setting targets without accounting for dependencies and complexity leads to bottlenecks.
- Undefined roles and responsibilities – Teams spend time clarifying tasks instead of executing them.
- Hidden risks – Technical debt, legacy systems, or vendor dependencies can slow progress if not anticipated.
- Changing priorities – Shifting business needs or market pressures often force teams to rework completed tasks.
By quantifying the impact of these issues, it becomes clear why proactive strategies are essential. Understanding these root causes is the first step to avoiding delays before they spiral out of control.
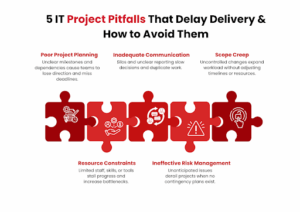
Poor Project Planning
Poor planning is one of the biggest reasons IT projects fall behind schedule. Without a clear roadmap, it’s easy for teams to lose direction, waste effort, and miss deadlines.
Consider this: projects that lack structured planning and clear requirements are significantly more prone to time and cost overruns—for instance, 47% of failed projects cite inaccurate requirements as a root cause. Poor planning often shows up as:
- Undefined milestones – Teams aren’t sure what to deliver and when.
- No priority framework – Critical tasks get delayed because everything feels equally urgent.
- Overlooked dependencies – A module that relies on another system may be delayed if the dependency isn’t accounted for.
To avoid this pitfall, start by:
- Breaking the project into measurable phases – Assign clear objectives and deadlines for each phase.
- Identifying dependencies upfront – Map out internal and external connections that could affect delivery.
- Building buffer time – Account for testing, reviews, and potential issues instead of aiming for a “perfect” schedule.
A solid plan doesn’t just keep you on schedule; it also reduces stress and improves team confidence, helping everyone focus on value rather than firefighting delays.
Inadequate Communication
Even the best-planned IT project can derail if communication breaks down. Teams may duplicate work, miss critical updates, or misinterpret requirements, all of which add delays and costs.
Studies show that projects with poor communication are 50% more likely to miss deadlines. Common issues include:
- Unclear reporting channels – Team members aren’t sure whom to update or where to find critical information.
- Limited stakeholder engagement – Decisions are delayed because key stakeholders aren’t involved in discussions early enough.
- Information silos – Different departments work in isolation, causing integration issues and rework.
To keep communication effective:
- Set regular check-ins and updates – Weekly or bi-weekly status meetings ensure everyone is aligned.
- Define clear reporting channels – Specify how progress, issues, and decisions should be communicated.
- Leverage collaborative tools – Project management platforms, shared dashboards, and document repositories reduce confusion and ensure transparency.
Strong communication doesn’t just prevent delays, it empowers your team to act quickly, make informed decisions, and maintain momentum throughout the project lifecycle.
Scope Creep
Scope creep occurs when project requirements expand beyond the original plan, often without adjusting timelines or resources. Even small changes can compound, causing significant delays and budget overruns.
Studies of project management across industries show that scope creep significantly reduces the chances of project success, especially in more complex endeavors.
In practice, even modest unchecked additions to scope can add several weeks or months to a project timeline if not managed properly. Common triggers include:
- Unclear requirements at the start – Teams may interpret objectives differently, leading to unplanned additions.
- Stakeholder changes mid-project – New features or priorities are added without assessing the impact on delivery.
- Poor change control – Requests for adjustments are implemented immediately rather than evaluated against the schedule and budget.
To prevent scope creep:
- Define requirements clearly upfront – Document business needs, technical specs, and acceptance criteria before work begins.
- Establish a change management process – Evaluate every request for its impact on timelines, costs, and resources.
- Communicate trade-offs – Make stakeholders aware of the consequences of adding new features mid-project.
By controlling scope, you keep the project focused, predictable, and easier to deliver on time, while still accommodating necessary improvements in a structured way.
Resource Constraints
Even a well-planned IT project can stall if your team lacks the right resources. Resource constraints aren’t just about staffing, they also include technology, budget, and skills.
In a broad survey of global projects, 50% fail to deliver on time or budget, often because of resource constraints.
For IT specifically, resource limitations (lack of staff, skill gaps, missing tools) frequently slow down delivery. Typical challenges include:
- Understaffed teams – Critical tasks are delayed because there aren’t enough hands to handle the workload.
- Skill gaps – Team members may lack expertise in specific technologies, requiring additional training or external support.
- Limited budget or tools – Delays occur when essential software, hardware, or testing environments aren’t available on time.
To address resource constraints:
- Assess resource needs early – Map out staffing, skills, and tools required for each project phase.
- Plan for contingencies – Have backup personnel or external partners ready to step in if needed.
- Prioritize budget allocations – Ensure critical areas, such as testing or infrastructure, aren’t underfunded.
By proactively managing resources, you keep the project moving smoothly, prevent bottlenecks, and improve overall delivery confidence.
Ineffective Risk Management
Failing to identify and manage risks is a silent killer of IT project timelines. Unexpected technical issues, vendor delays, or regulatory changes can derail progress if they aren’t anticipated and mitigated.
Statistics show that projects with poor risk management are 40% more likely to miss deadlines. Common risk-related issues include:
- Unidentified dependencies – Critical systems or third-party services fail to deliver on time.
- Lack of contingency planning – Teams scramble when unexpected problems arise, causing delays.
- Reactive approach – Risks are addressed only after they occur, rather than being proactively mitigated.
To avoid these pitfalls:
- Conduct a thorough risk assessment – Identify potential technical, operational, and external risks before the project starts.
- Prioritize risks by impact – Focus on high-probability and high-impact risks first.
- Develop mitigation strategies – Have backup plans, resource allocations, and escalation procedures in place.
Effective risk management ensures that surprises don’t derail your timeline, allowing your team to stay on track even when challenges arise.
Actionable Takeaways
Delays in IT projects don’t have to be inevitable. For IT companies in Mumbai, addressing the five common pitfalls: poor planning, inadequate communication, scope creep, resource constraints, and ineffective risk management can keep projects on schedule, reduce costs, and deliver measurable business value.
To recap actionable steps:
- Plan meticulously – Break projects into clear phases, account for dependencies, and build buffer time.
- Communicate effectively – Set reporting channels, hold regular updates, and use collaborative tools.
- Control scope – Define requirements clearly and manage changes with a structured process.
- Manage resources smartly – Assess staffing, skill sets, and tools upfront, and plan contingencies.
- Mitigate risks proactively – Identify, prioritize, and plan for potential challenges before they become roadblocks.
At SCSTech, we specialize in guiding organizations through complex IT projects with precision and expertise. Our team helps you plan strategically, streamline execution, and anticipate challenges so that your projects are delivered on time and within budget.
Contact SCSTech today to partner with experts who can turn your IT initiatives into predictable, successful outcomes.