Urban sanitation management at scale needs something more than labor and fixed protocols. It calls for systems that can dynamically respond to real-time conditions, bin status, public cleanliness, route efficiency, and service accountability.
That’s where AI-based sanitation enters the picture. Designed on sensor information, predictive models, and automation, these systems are already deployed in Indian cities to minimize waste overflow, optimize collection, and enhance public health results.
This article delves into how these systems function, the underlying technologies that make them work, and why they’re becoming critical infrastructure for urban service providers and solution makers.
What Is an AI-Driven Sanitation System?
An AI sanitation system uses artificial intelligence to improve monitoring, management, and collection of urban waste. In contrast to traditional buildings that rely on pre-programmed schedules and visual checking, this system works by gathering real-time data from the ground and making more informed decisions based on it.
Smart sensors installed in waste bins or street toilets detect fill levels, foul odours, or cleaning needs. This is transmitted to a central platform, where machine learning techniques scan patterns, e.g., how fast waste fills up in specific zones or where overflows are most likely to occur. From this, the system can automate alarms, streamline waste collection routes, and assist city staff in taking action sooner.
Core Technologies That Power Smart Sanitation in Cities
The development of a smart sanitation system begins with the knowledge of how various technologies converge to monitor, analyze, and react to conditions of waste in real time. Such systems are not isolated; they exist as an ecosystem.
This is how the main pieces fit together:
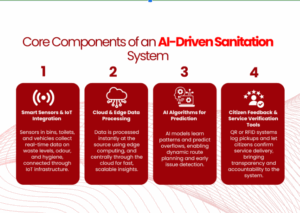
1. Smart Sensors and IoT Integration
Sanitation systems depend on ultrasonic sensors, smell sensors, and environmental sensors placed in bins, toilets, and trucks. They monitor fill levels, gas release (such as ammonia or hydrogen sulfide), temperature, and humidity. Placed throughout a city once installed, they become the sensory layer, sensing the changes way before human inspections would.
Each sensor is linked using Internet of Things (IoT) infrastructure, which permits the data to run continuously to a processing platform. Such sensors have been installed in more than 350 public toilets by cities like Indore to track hygiene in real-time.
2. Cloud and Edge Data Processing
Data must be acted upon as soon as it is captured. This is done with cloud-based analytics coupled with edge computing, which processes data close to the source. These layers enable data to be cleansed, structured, and organized in order to be understandably presented to AI.
This blend is capable of taking even high-volume, dispersed data from thousands of bins or collection vehicles and aggregating it with little latency and maximum availability.
3. AI Algorithms for Prediction and Optimization
This is the layer of intelligence. We develop machine learning models based on both historical and real-time data to understand at what times bins are likely to overflow, what areas will generate waste above the anticipated threshold, and how to reduce time and fuel in collection routes.
In a recent research, the cities that adopted AI-driven route planning experienced over 28% decrease in collection time and over 13% reduction in costs against manual scheduling models.
4. Citizen Feedback and Service Verification Tools
Several systems also comprise QR code or RFID-based monitoring equipment that records every pickup and connects it to a particular home or stop. Residents can check if their bins were collected or report if they were not. Service accountability is enhanced, and governments have an instant service quality dashboard.
Door-to-door waste collection in Ranchi, for instance, is now being tracked online, and contractors risk penalties for missed collections.
These technologies operate optimally when combined, but as part of an integrated, AI-facilitated infrastructure. That’s what makes a sanitation setup a clever, dynamic city service.
How Cities Are Already Using AI for Sanitation
Many Indian cities are past pilot projects and, in effect, use it to rectify real, operational inefficiencies.
These examples indicate how AI is not simply a bag of data, but the data is being utilized for decision-making, problem-solving, and enhancing effectiveness on the ground.
1. Real-Time Hygiene Monitoring
Indore, one of India’s top-ranking cities under Swachh Bharat, has installed smart sensors in over 350 public toilets. These sensors monitor odour levels, air quality, water availability, and cleaning frequency.
What is salient is not the sensors, but how the city is utilizing that data. Staff cleaning units, for example, get automated alerts when conditions fall below the city’s set thresholds (e.g., hours of rain), and instead of acting on expected days of service, they are doing services on need-derived data; used less water and improved experience.
This is where AI plays its role, learning usage patterns over time and helping optimize cleaning cycles, even before complaints arise.
2. Transparent Waste Collection
Jharkhand has implemented QR-code and RFID-based tracking systems for doorstep waste collection. Every household pickup is electronically recorded, giving rise to a verifiable chain of service history.
But AI kicks in when patterns start to set in. If specific routes have regularly skipped pickups, or if the frequency of collection falls below desired levels, the system can highlight irregularities and impose penalties on contractors.
This type of transparency enables improved contract enforcement, resource planning, and public accountability, key issues in traditional sanitation systems.
3. Fleet Optimization and Air Quality Goals
In Lucknow, the municipal corporation introduced over 1,250 electric collection vehicles and AI-assisted route planning to reduce delays and emissions.
While the shift to electric vehicles is visible, the invisible layer is where the real efficiency comes in. AI helps plan which routes need what types of vehicles, how to avoid congestion zones, and where to deploy sweepers more frequently based on dust levels and complaint data.
The result? Cleaner streets, reduced PM pollution, and better air quality scores, all tracked and reported in near real-time.
From public toilets to collection fleets, cities across India are using AI to respond faster, act smarter, and serve better, without adding manual burden to already stretched civic teams.
Top Benefits of AI-Enabled Sanitation Systems for Urban Governments
When sanitation systems start responding to real-time data, governments don’t just clean cities more efficiently; they run them more intelligently. AI brings visibility, speed, and structure to what has traditionally been a reactive and resource-heavy process.
Here’s what that looks like in practice:
- Faster issue detection and resolution – Know the problem before a citizen reports it, whether it’s an overflowing bin or an unclean public toilet.
- Cost savings over manual operations – Reduce unnecessary trips, fuel use, and overstaffing through route and task optimization.
- Improved public hygiene outcomes – Act on conditions before they create health risks, especially in dense or underserved areas.
- Better air quality through cleaner operations – Combine electric fleets with optimized routing to reduce emissions in high-footfall zones.
- Stronger Swachh Survekshan and ESG scores – Gain national recognition and attract infrastructure incentives by proving smart sanitation delivery.
Conclusion
Artificial intelligence is already revolutionizing the way urban sanitation is designed, delivered, and scaled. But for organizations developing these solutions, speed and flexibility are just as important as intelligence.
Whether you are creating sanitation technology for city bodies or incorporating AI into your current civic services, SCSTech assists you in creating more intelligent systems that function in the field, in tune with municipal requirements, and deployable immediately. Reach out to us to see how we can assist with your next endeavor.
FAQs
1. How is AI different from traditional automation in sanitation systems?
AI doesn’t just automate fixed tasks; it uses real-time data to learn patterns and predict needs. Unlike rule-based automation, AI can adapt to changing conditions, forecast bin overflows, and optimize operations dynamically, without needing manual reprogramming each time.
2. Can small to mid-size city projects afford to have AI in sanitation?
Yes. With scalable architecture and modular integration, AI-based sanitation solutions can be tailored to suit various project sizes. Most smart city vendors today use phased methods, beginning with the essential monitoring capabilities and adding full-fledged AI as budgets permit.
3. What kind of data is needed to make an AI sanitation system work effectively?
The system relies on real-time data from sensors, such as bin fill levels, odour detection, and GPS tracking of collection vehicles. Over time, this data helps the AI model identify usage patterns, optimize routes, and predict maintenance needs more accurately.